Upload date
All time
Last hour
Today
This week
This month
This year
Type
All
Video
Channel
Playlist
Movie
Duration
Short (< 4 minutes)
Medium (4-20 minutes)
Long (> 20 minutes)
Sort by
Relevance
Rating
View count
Features
HD
Subtitles/CC
Creative Commons
3D
Live
4K
360°
VR180
HDR
3,679,891 results
Build an interactive Excel dashboard for better data visualization in less than 20 minutes. ❗Master Excel with my courses: ...
75,855 views
1 year ago
This comprehensive tutorial will teach you everything you need to know about Excel chart types, chart customization, and creating ...
109,151 views
Learn Excel in just 2 hours: https://kevinstratvert.thinkific.com In this step-by-step tutorial, learn how to pull together charts in Excel.
1,255,211 views
2 years ago
Data Visualization Monthly Budget Tracker https://shorturl.at/fhlwz.
62,866 views
3 years ago
In this video, you'll learn how to visualize data totals, trends, geographical data, and more with Excel's TOP 5 data visualization ...
7,011 views
Learn Data Analysis Essentials in Excel in Just 12 minutes! Take our Data Analyst Program here: ...
160,042 views
Download the free course files and follow along here: ➡️https://www.simonsezit.com/charts-and-dashboards-in-excel-demo-files ...
12,453 views
AD: Sign up to enroll for a 7-day free trial with Coursera now!
3,078,532 views
... DOWNLOAD Free Excel file for this video: https://view.flodesk.com/pages/63dd44d5781752946ff2af78 In this video we'll build a ...
1,753,399 views
"️ IBM - Data Analyst ...
14,333 views
In this step-by-step tutorial, learn how to create dynamic and interactive Excel dashboards. With a dashboard, you can showcase ...
3,547,059 views
4 years ago
OFF My Dashboards Course (code: SAVE50) https://chandoo.org/wp/excel-school-program/ ~ Become an Excel Dashboard ...
72,848 views
3 months ago
Ready to transform your spreadsheets from ordinary to extraordinary? In this tutorial, you'll learn how to take raw, unorganized ...
112,660 views
... Free Excel file for this video: https://careerprinciples.myflodesk.com/mssfixa655 In this video, I make 3 McKinsey visuals in Excel ...
447,556 views
https://other-levels.com/products/one-time-full-access The #1 Website Worldwide for Excel Dashboard Templates, Reports, ...
6,387,139 views
Follow me on LinkedIn https://www.linkedin.com/in/luke-b/ OR on X/Twitter https://twitter.com/LukeBarousse Subscribe to ...
248,809 views
Welcome to this beginner's tutorial on how to use Microsoft Power BI! In this video, I will guide you through importing data from an ...
201,775 views
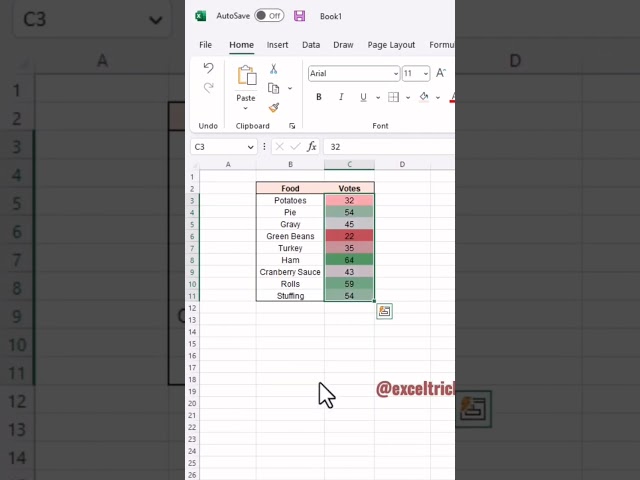
Build Dynamic Pie Charts & Filter with Slicers in Excel! (Easy Guide) Unlock hidden insights from your data with interactive pie ...
32,997 views
FREE Course Files & Projects https://lukeb.co/excel_files Supporter Access: Problems, Certificate, & More ...
2,262,957 views
Links mentioned in this video ⬇️ Exercise File ...
247,694 views
Data visualization in excel | 2 Easy data visualization tools |
89,259 views
excelchart #excelcharts #excelchartstutorial This comprehensive video will teach you everything you need to know about Excel ...
1,586 views
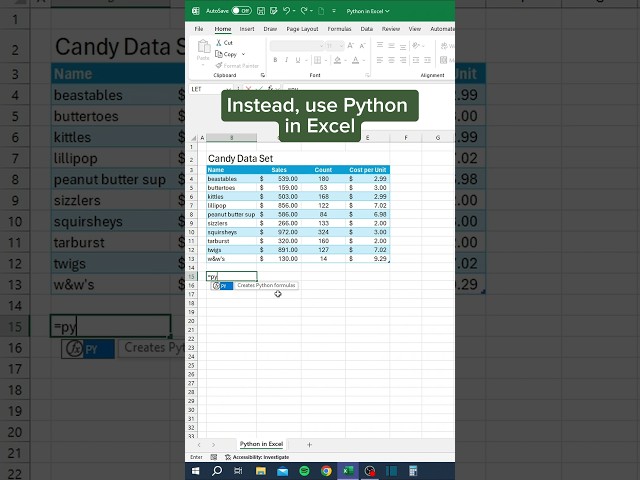
In this video we show a basic function of Python in Excel. Don't forget to register for a FREE Excel Class at the link below!
609,155 views
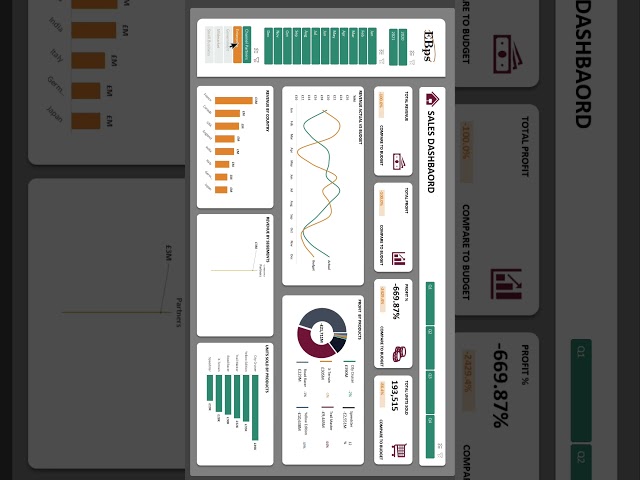
Take your sales reporting to the next level with this comprehensive guide on building a dynamic Sales Excel Dashboard tailored ...
264,002 views
Saw the intern visualizing his data like this so I showed him this tip activate python store your data as a python data.
77,251 views