Upload date
All time
Last hour
Today
This week
This month
This year
Type
All
Video
Channel
Playlist
Movie
Duration
Short (< 4 minutes)
Medium (4-20 minutes)
Long (> 20 minutes)
Sort by
Relevance
Rating
View count
Features
HD
Subtitles/CC
Creative Commons
3D
Live
4K
360°
VR180
HDR
20,242 results
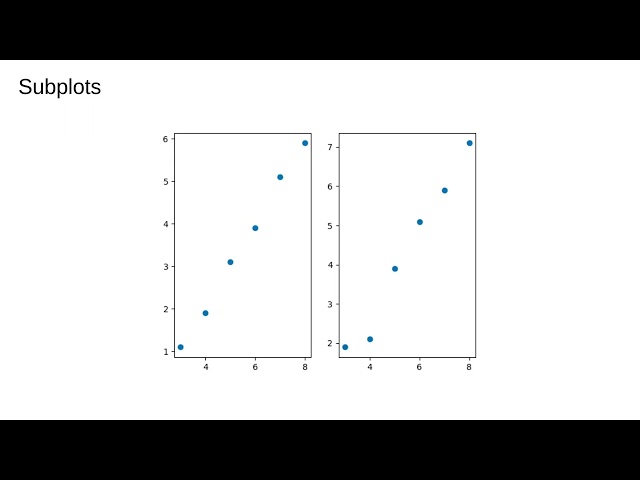
An introduction to the object oriented API and a discussion of ways to make grids of figures and inset plots.
461 views
3 years ago
In this video, we dive deep into the world of data visualization in Python using three powerful libraries: Matplotlib, Seaborn, and ...
3,058 views
1 year ago
Example of an animation with various subplots and axes using Python and Matplotlib.
21,489 views
13 years ago
Get ready for a shocking combination! In this video, we'll reveal the power of combining Matplotlib and Pandas in Jupyter ...
82 views
... standard of python graphical representation a library known as matplotlib this is again one of the most common libraries when ...
171 views
4 years ago
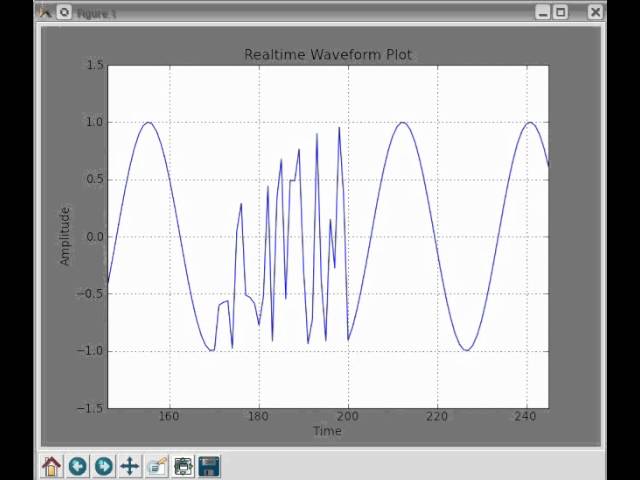
Realtime Plotting with Python and pylab/matplotlib More info and source code at: ...
30,458 views
14 years ago
Good afternoon evening and everything in between as you can tell what we're going to be talking about today is matplotlib the ...
1,150 views
5 years ago
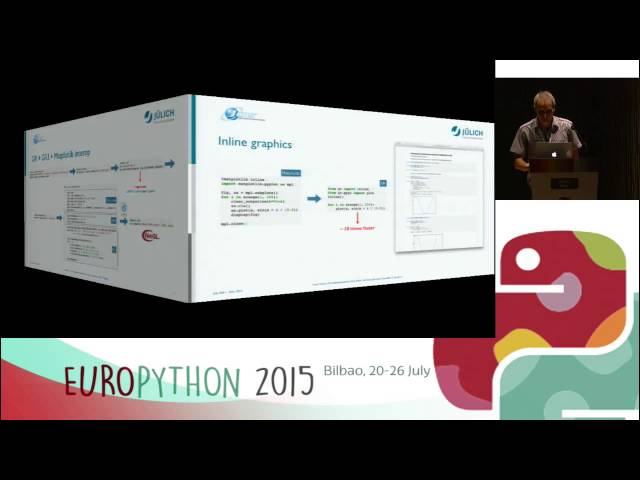
Josef Heinen - Getting more out of Matplotlib with GR [EuroPython 2015] [20 July 2015] [Bilbao, Euskadi, Spain] Python is well ...
575 views
10 years ago
Making high-quality data visualizations can take hours - but it doesn't have to. We'll walk through a clean, efficient workflow for ...
202 views
4 months ago
... i'm importing matplotlib i'm importing a subplot or subportion of matplotlib again instead of being pie plots i'm actually importing ...
343 views
Data Science Mentorship Program (DSMP) 2022-23 Enroll in this Programme from our Website - https://learnwith.campusx.in/ ...
116,373 views
Streamed 3 years ago
18 views
67,482 views
Download Excel VBA MIS Learning - App - https://play.google.com/store/apps/details?id=co.hodor.jqijz iOS ...
5 views
2 months ago
Course materials at https://www.cs.columbia.edu/~amueller/comsw4995s20/schedule/
16,282 views
6 years ago
Getting started with matplotlib. Introduction to matplotlib. How to create a plot using matplotlib? #coding #learnpython ...
1,032 views
The Matplotlib figure canvas renderer can be confusing to wrestle with if you don't know how it actually works. By the end of this ...
9,372 views
3 months ago
In this video I walk through a simple example of how to install and use the matplotlib libary to make simple charts ...
1,023 views
An introduction to matplotlib explaining how to make some basic plot types like line graphs, scatter plots, bar charts and pie charts.
590 views
Take your first steps in plotting with Matplotlib! An introduction to Python based on the AstPy-10 notebook activity Planetary ...
158 views
Presenter: Mike Müller.
662 views
8 years ago
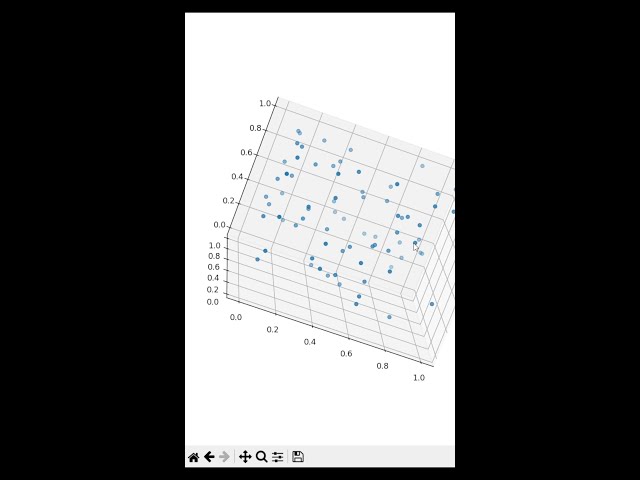
Getting started with matplotlib. Introduction to matplotlib. How to create a 3D plot using matplotlib? How to draw a 3D scatter plot ...
2,082 views
This video is about creating basic plots with matplotlib in the Jupyter notebook. Links: https://github.com/mlund/jupyter-course ...
162 views
7 years ago
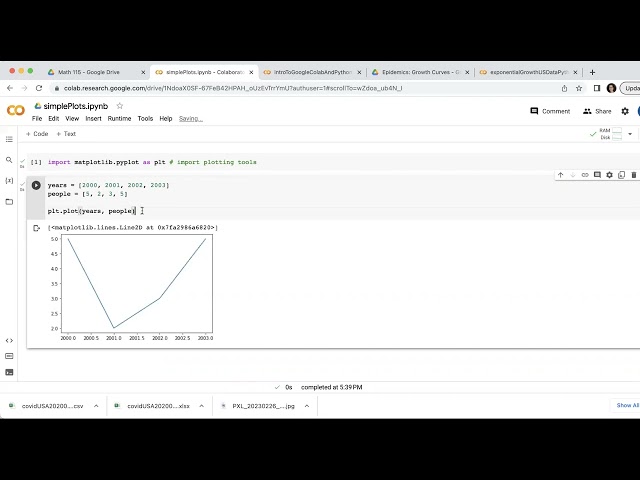
How to make a simple line plot and scatterplot using Python's matplotlib in Google Colab.
531 views
2 years ago
Description: "Welcome to our comprehensive Python tutorial where we dive into creating circles using Matplotlib!
115 views
Here we show how to make some fancier kinds of plots with annotations, color gradients and polar axes. We also talk about how ...
820 views