Upload date
All time
Last hour
Today
This week
This month
This year
Type
All
Video
Channel
Playlist
Movie
Duration
Short (< 4 minutes)
Medium (4-20 minutes)
Long (> 20 minutes)
Sort by
Relevance
Rating
View count
Features
HD
Subtitles/CC
Creative Commons
3D
Live
4K
360°
VR180
HDR
20,256 results
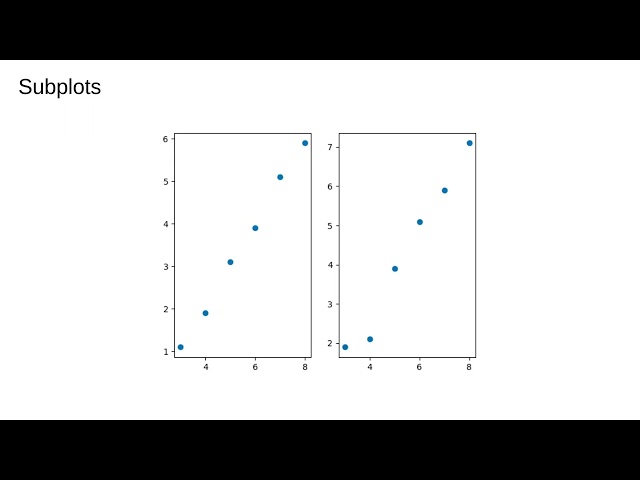
An introduction to the object oriented API and a discussion of ways to make grids of figures and inset plots.
461 views
3 years ago
In this video, we dive deep into the world of data visualization in Python using three powerful libraries: Matplotlib, Seaborn, and ...
3,072 views
1 year ago
Example of an animation with various subplots and axes using Python and Matplotlib.
21,491 views
13 years ago
Get ready for a shocking combination! In this video, we'll reveal the power of combining Matplotlib and Pandas in Jupyter ...
82 views
... standard of python graphical representation a library known as matplotlib this is again one of the most common libraries when ...
171 views
4 years ago
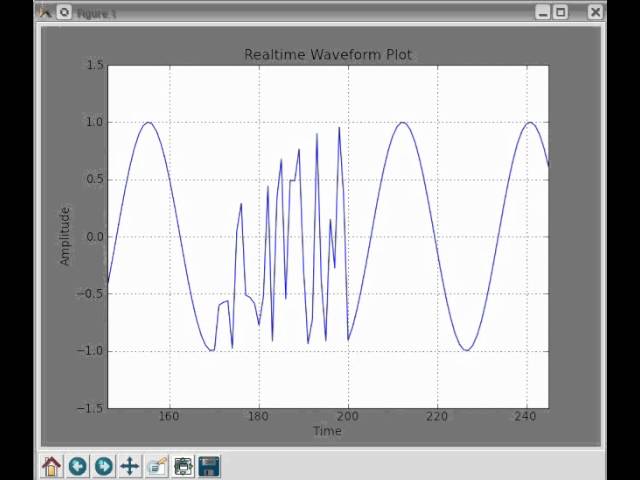
Realtime Plotting with Python and pylab/matplotlib More info and source code at: ...
30,458 views
14 years ago
Good afternoon evening and everything in between as you can tell what we're going to be talking about today is matplotlib the ...
1,151 views
5 years ago
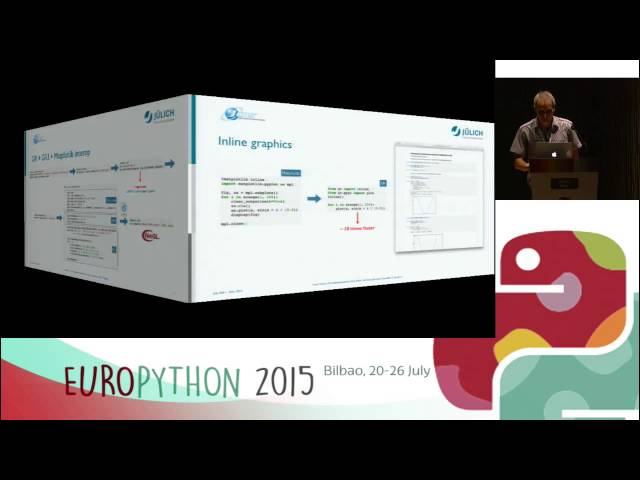
Josef Heinen - Getting more out of Matplotlib with GR [EuroPython 2015] [20 July 2015] [Bilbao, Euskadi, Spain] Python is well ...
575 views
10 years ago
Making high-quality data visualizations can take hours - but it doesn't have to. We'll walk through a clean, efficient workflow for ...
202 views
4 months ago
... i'm importing matplotlib i'm importing a subplot or subportion of matplotlib again instead of being pie plots i'm actually importing ...
343 views
Data Science Mentorship Program (DSMP) 2022-23 Enroll in this Programme from our Website - https://learnwith.campusx.in/ ...
116,502 views
Streamed 3 years ago
18 views
hello there, in this lesson, we will use geopandas and matplotlib to plot a geographic map from a CSV file with longitude and ...
64,410 views
Course materials at https://www.cs.columbia.edu/~amueller/comsw4995s20/schedule/
16,284 views
6 years ago
67,543 views
Getting started with matplotlib. Introduction to matplotlib. How to create a plot using matplotlib? #coding #learnpython ...
1,033 views
In this video I walk through a simple example of how to install and use the matplotlib libary to make simple charts ...
1,023 views
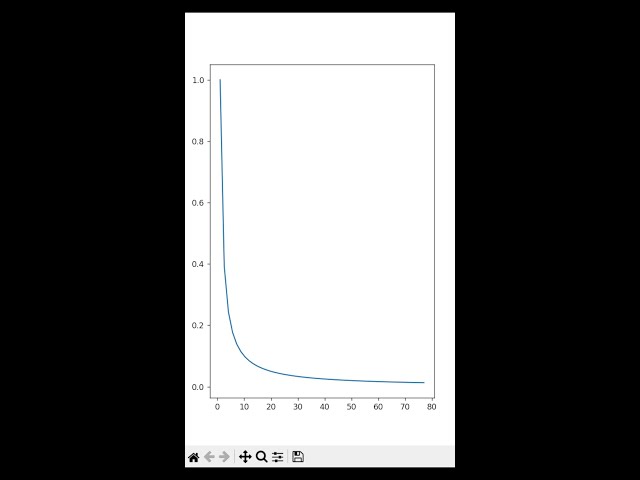
The Matplotlib figure canvas renderer can be confusing to wrestle with if you don't know how it actually works. By the end of this ...
9,394 views
3 months ago
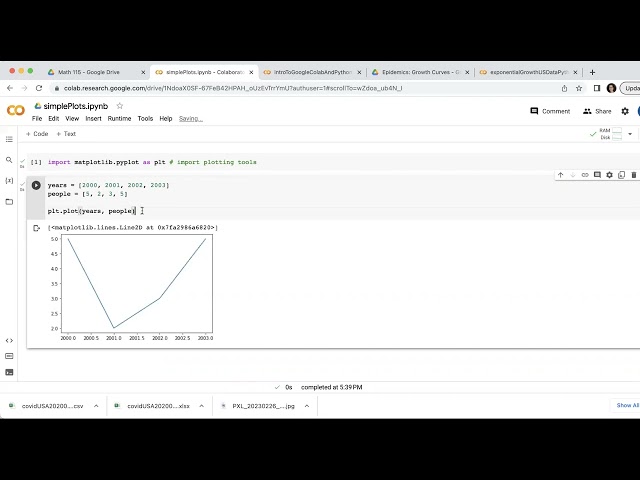
How to make a simple line plot and scatterplot using Python's matplotlib in Google Colab.
531 views
2 years ago
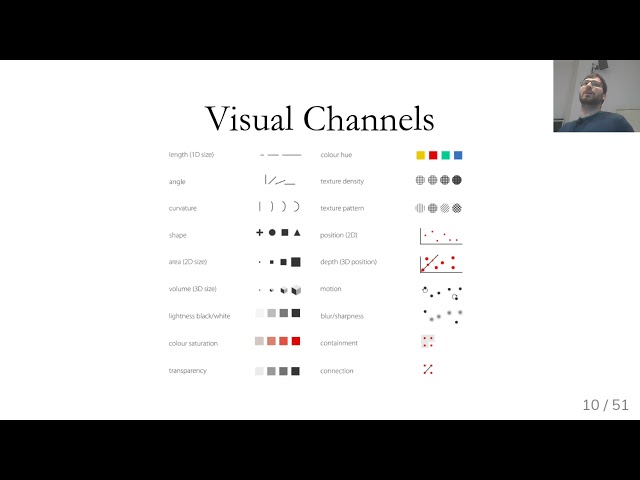
An introduction to matplotlib explaining how to make some basic plot types like line graphs, scatter plots, bar charts and pie charts.
590 views