Upload date
All time
Last hour
Today
This week
This month
This year
Type
All
Video
Channel
Playlist
Movie
Duration
Short (< 4 minutes)
Medium (4-20 minutes)
Long (> 20 minutes)
Sort by
Relevance
Rating
View count
Features
HD
Subtitles/CC
Creative Commons
3D
Live
4K
360°
VR180
HDR
19,550 results
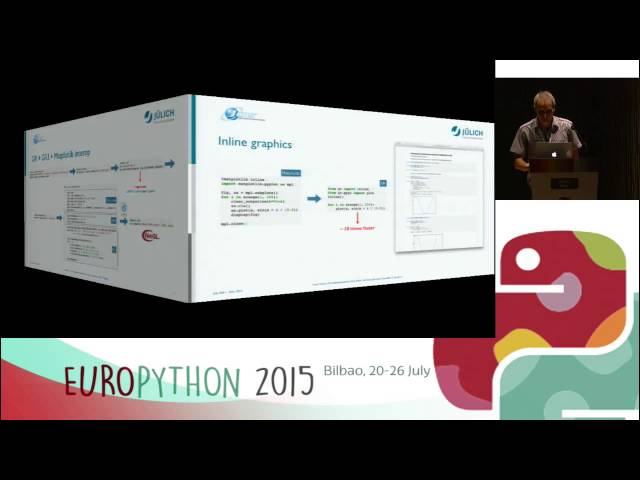
Josef Heinen - Getting more out of Matplotlib with GR [EuroPython 2015] [20 July 2015] [Bilbao, Euskadi, Spain] Python is well ...
575 views
10 years ago
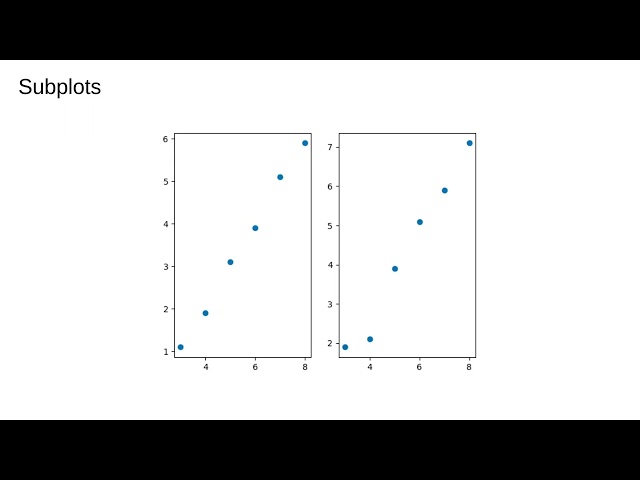
Example of an animation with various subplots and axes using Python and Matplotlib.
21,466 views
13 years ago
An introduction to the object oriented API and a discussion of ways to make grids of figures and inset plots.
457 views
3 years ago
... i'm importing matplotlib i'm importing a subplot or subportion of matplotlib again instead of being pie plots i'm actually importing ...
342 views
4 years ago
... standard of python graphical representation a library known as matplotlib this is again one of the most common libraries when ...
170 views
Data Science Mentorship Program (DSMP) 2022-23 Enroll in this Programme from our Website - https://learnwith.campusx.in/ ...
113,300 views
Streamed 3 years ago
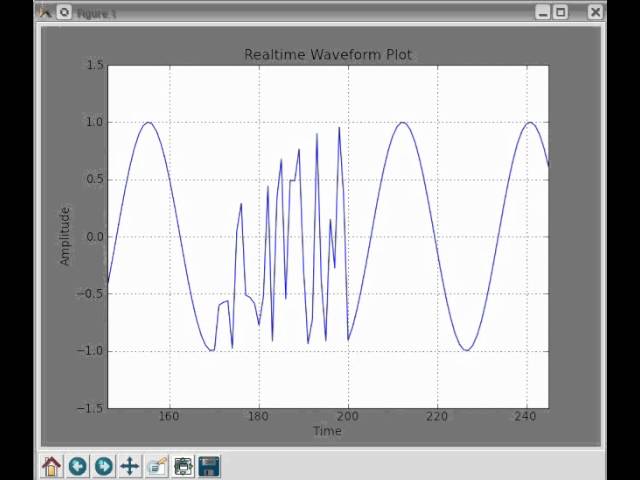
Realtime Plotting with Python and pylab/matplotlib More info and source code at: ...
30,454 views
14 years ago
65,745 views
Course materials at https://www.cs.columbia.edu/~amueller/comsw4995s20/schedule/
16,237 views
6 years ago
Making high-quality data visualizations can take hours - but it doesn't have to. We'll walk through a clean, efficient workflow for ...
187 views
3 months ago
Showing some of the basic customization options for the most common pyplot functions like plot, scatter and bar.
426 views
Good afternoon evening and everything in between as you can tell what we're going to be talking about today is matplotlib the ...
1,145 views
5 years ago
Here we show how to make some fancier kinds of plots with annotations, color gradients and polar axes. We also talk about how ...
806 views
An introduction to matplotlib explaining how to make some basic plot types like line graphs, scatter plots, bar charts and pie charts.
583 views
In this video we show how to make some simple animations, including a rotating 3d plot.
615 views
Presenter: Mike Müller.
662 views
8 years ago
In this video I walk through a simple example of how to install and use the matplotlib libary to make simple charts ...
1,022 views
Video Description: Master Data Visualization with Python: From Beginner to Advanced! In this comprehensive Data ...
36,522 views
1 year ago
hello there, in this lesson, we will use geopandas and matplotlib to plot a geographic map from a CSV file with longitude and ...
64,249 views
No module named 'matplotlib.backends.registry' (4 SOLUTIONS!!) ✧ I really hope you found a helpful solution! ♡ The Content is ...
81 views
11 months ago
Get to know Python's matplotlib and pandas libraries for plotting your data based on materials provided at ...
75 views
This video is about creating basic plots with matplotlib in the Jupyter notebook. Links: https://github.com/mlund/jupyter-course ...
161 views
7 years ago
Take your first steps in plotting with Matplotlib! An introduction to Python based on the AstPy-10 notebook activity Planetary ...
158 views
How to make contour plots, heat maps and other 3d plots using matplotlib.
329 views
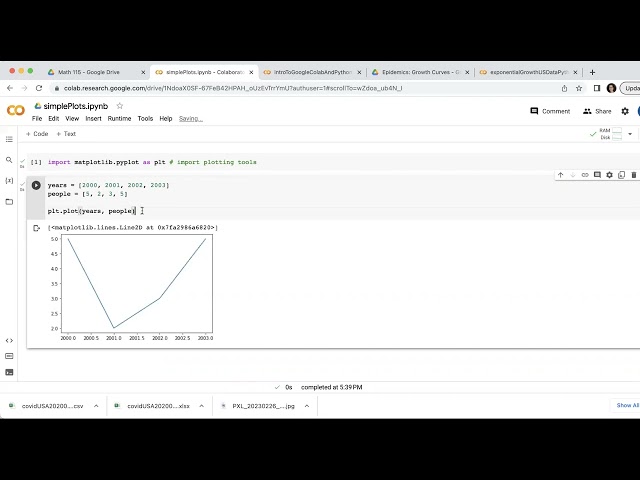
How to make a simple line plot and scatterplot using Python's matplotlib in Google Colab.
529 views
2 years ago