Upload date
All time
Last hour
Today
This week
This month
This year
Type
All
Video
Channel
Playlist
Movie
Duration
Short (< 4 minutes)
Medium (4-20 minutes)
Long (> 20 minutes)
Sort by
Relevance
Rating
View count
Features
HD
Subtitles/CC
Creative Commons
3D
Live
4K
360°
VR180
HDR
168,283 results
If you're still using console.log() to find and fix JavaScript issues, you might be spending more time debugging than you need to.
907,894 views
8y ago
Perhaps use this approach to better understand what your Go based command line interface (CLI) apps are doing. 00:00 Setup ...
2,272 views
2y ago
Tools and Techniques to Debug an Embedded Linux System - Sergio Prado, Embedded Labworks [Presented in English]
619 views
3y ago
In this video, we show a step by step walkthrough of troubleshooting unreliable PCIe operation using ngscopeclient. 00:00 ...
1,806 views
3mo ago
CLS is short for Cumulative Layout Shift (CLS. Debug CLS with Performance Insights in the updated Chrome DevTools ...
37,584,060 views
6mo ago
Edebug, instrumenting and stepping and breakpoints. Also macroexpand and how it helps with debugging.
9,427 views
11y ago
Let's take a look into the iOS Bluetooth stack! Logging all packets with PacketLogger is easy, but how does it work internally?
4,348 views
shorts Check out the channel to learn how to do this yourself!
3,805 views
While WordPress's built-in debugging options should cover most of your needs, there are a number of plugins that can help you ...
1,839 views
1y ago
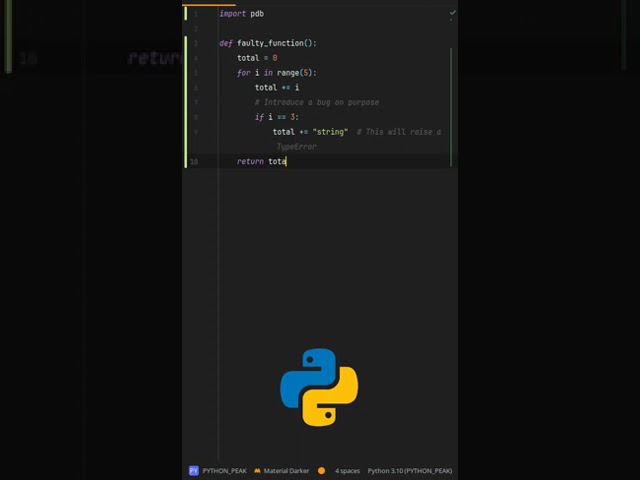
What's the best way to debug Python code with pdb? 🎟️ Using pdb makes finding bugs easier and faster. 🎟️ You can pause ...
7,074 views
What's the quickest way to debug PHP code? Using error_reporting can show all errors quickly. Combine it with ...
1,446 views
LCP is short for Largest Contentful Paint. Debug LCP with Performance Insights in the updated Chrome DevTools Performance ...
36,385,472 views
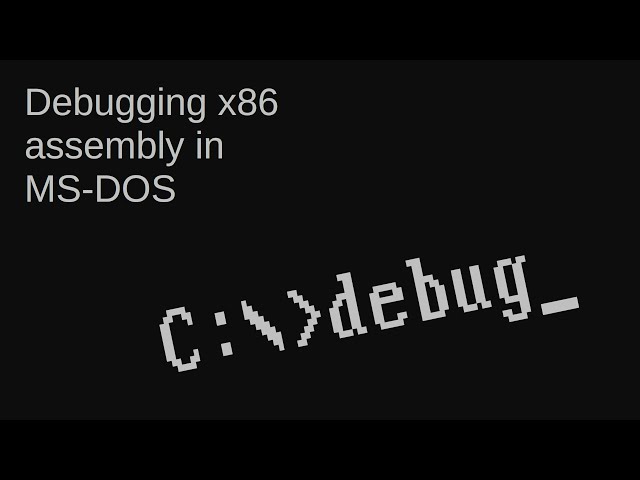
I do a demonstration of writing and debugging x86 assembly language code using the MS-DOS debug utility. 00:00 ...
10,795 views
4y ago
Chrome DevTools now has a Model Context Protocol (MCP) server that lets AI agents interact directly with your browser.
8,280 views
2mo ago
You can book One to one consultancy session with me on Mentoga: https://mentoga.com/muhammadaammartufail ...
131 views
5mo ago
AI Tools For Productivity | AI Software Testing | No-Code Testing ✓ TestSprite MCP Official: https://linktr.ee/TestSpriteMCP ...
7,368 views
Learn how to inspect and debug various Storage APIs using the Application panel in Chrome DevTools. Matthias shares how to ...
3,129 views
1mo ago
https://media.ccc.de/v/ASG2018-213-a_debugger_from_scratch At some stage in your programming life you may well have used ...
7,144 views
7y ago
You can find the lecture notes and exercises for this lecture at https://missing.csail.mit.edu/2026/debugging-profiling/ 0:00:00 ...
11,009 views
Mentor: Joel Fernandes, Staff Software Engineer, Google In this enlightening webinar, "Linux Kernel Debugging Tricks of the ...
15,209 views
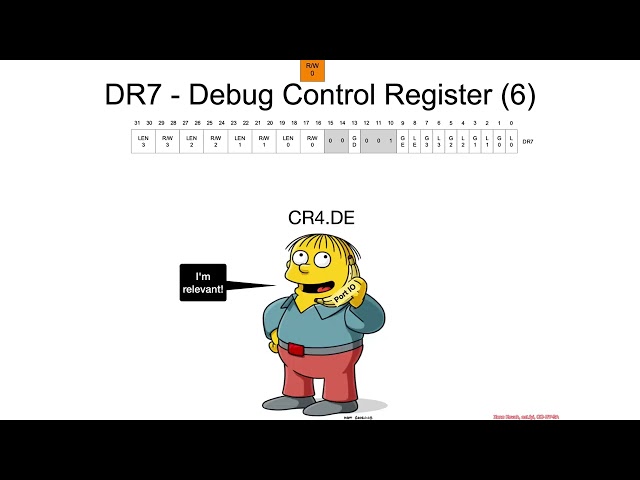
You can watch this class without ads and with quizzes and lab setup instructions by going to https://ost2.fyi/Arch2001.
1,208 views
Performance debugging just got a whole lot easier. Learn how our new Chrome DevTools Performance panel is more accessible ...
20,657 views
10mo ago
The command line debugger that comes with perl is very powerful. Not only does it allow us to debug script but it can be used as a ...
8,035 views
14y ago
Developers use frameworks, multiple languages, and libraries to build their web applications. Browsers only see the resulting ...
10,741 views


![[26] Debugging PCIe flapping on STM32MP257 with ngscopeclient](/api/proxy/image?url=https%3A%2F%2Fi.ytimg.com%2Fvi%2FqxdK3mjHNBM%2Fsddefault.jpg)


![[0x09] Reversing Shorts :: iOS Bluetooth Debugging Driver Internals & Packet Logging](/api/proxy/image?url=https%3A%2F%2Fi.ytimg.com%2Fvi%2F3uILiFL83v4%2Fsddefault.jpg)