ViewTube

ViewTube
Sign inSign upSubscriptions
Filters

Upload date

Type

Duration

Sort by

Features

Reset

2,709 results

freeCodeCamp.org
Learn Data Science Tutorial - Full Course for Beginners

Learn Data Science is this full tutorial course for absolute beginners. Data science is considered the "sexiest job of the 21st ...

5:52:09
Learn Data Science Tutorial - Full Course for Beginners

4,350,767 views

6 years ago

freeCodeCamp Talks
A Gentle Introduction to Data Science - talk by Marc Garcia

Covers the basics of data science. Including artificial intelligence and a practical demo on how to build a hello world machine ...

32:08
A Gentle Introduction to Data Science - talk by Marc Garcia

1,933 views

8 years ago

freeCodeCamp.org
Python for Everybody - Full University Python Course

This Python 3 tutorial course aims to teach everyone the basics of programming computers using Python. The course has no ...

13:40:10
Python for Everybody - Full University Python Course

7,595,405 views

6 years ago

Alex The Analyst
Best Course to Learn Statistics for Data Analysis

... Python for Data Analysis and Visualization- https://bit.ly/3hhX4LX Statistics for Data Science - https://bit.ly/37jqDbq SQL for Data ...

6:12
Best Course to Learn Statistics for Data Analysis

134,983 views

4 years ago

Ganesh H
Visualize Data with a Heat Map - freeCodeCamp Data Visualization Project Tutorial

This is a walkthrough for the freeCodeCamp Heat Map project from start to finish. We import some JSON data about global ...

57:21
Visualize Data with a Heat Map - freeCodeCamp Data Visualization Project Tutorial

9,522 views

5 years ago

Alex The Analyst
FREE Data Analyst Bootcamp!!

... Data Visualization - https://coursera.pxf.io/MXYqaN Udemy Courses: Python for Data Science - https://bit.ly/3Z4A5K6 ...

6:52
FREE Data Analyst Bootcamp!!

2,547,245 views

3 years ago

Alex The Analyst
Data Cleaning in Pandas | Python Pandas Tutorials

... Courses: Python for Data Analysis and Visualization- https://bit.ly/3hhX4LX Statistics for Data Science - https://bit.ly/37jqDbq ...

38:37
Data Cleaning in Pandas | Python Pandas Tutorials

540,497 views

2 years ago

Alex The Analyst
Google vs IBM Data Analytics Certificates | Which is Better?

... Python for Data Analysis and Visualization- https://bit.ly/3hhX4LX Statistics for Data Science - https://bit.ly/37jqDbq SQL for Data ...

5:58
Google vs IBM Data Analytics Certificates | Which is Better?

393,686 views

4 years ago

Ganesh H
3 - Work with Data - Data Visualization with D3 - freeCodeCamp Tutorial

We look at the data and enter methods to associate a set of HTML elements with a set of data, and create and modify elements.

4:32
3 - Work with Data - Data Visualization with D3 - freeCodeCamp Tutorial

644 views

5 years ago

Alex The Analyst
Learn Pandas in Under 3 Hours | Filtering, Joins, Indexing, Data Cleaning, Visualizations

... Tableau Data Visualization - https://coursera.pxf.io/MXYqaN Udemy Courses: Python for Data Science - https://bit.ly/3Z4A5K6 ...

2:40:07
Learn Pandas in Under 3 Hours | Filtering, Joins, Indexing, Data Cleaning, Visualizations

120,514 views

1 year ago

Ganesh H
4 - Work with Dynamic Data - Data Visualization with D3 - freeCodeCamp Tutorial

We're now going to set the heading text dynamically by providing a function into the text() method, instead of a string. This function ...

2:10
4 - Work with Dynamic Data - Data Visualization with D3 - freeCodeCamp Tutorial

890 views

5 years ago

Alex The Analyst
Learn SQL Beginner to Advanced in Under 4 Hours

... Tableau Data Visualization - https://coursera.pxf.io/MXYqaN Udemy Courses: Python for Data Science - https://bit.ly/3Z4A5K6 ...

4:04:58
Learn SQL Beginner to Advanced in Under 4 Hours

1,304,382 views

1 year ago

Ganesh H
7 - Add Classes - Data Visualization with D3 - freeCodeCamp Tutorial

We can add classes using the d3 attribute method. We can give an attribute of 'class' as the first argument, and we can give a ...

2:31
7 - Add Classes - Data Visualization with D3 - freeCodeCamp Tutorial

549 views

5 years ago

Ganesh H
13 - Dynamically Set Coordinates for Each Bar - Data Visualization with D3 - freeCodeCamp Tutorial

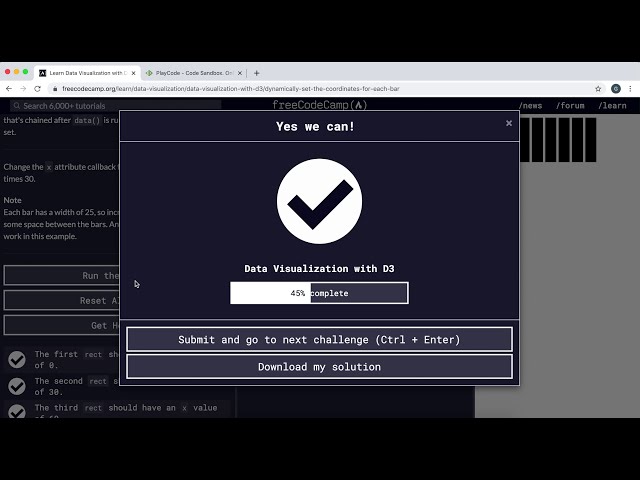
We're gonna dynamically set the x coordinate of the bars using the array index to give them a balanced separation to distinguish ...

2:46
13 - Dynamically Set Coordinates for Each Bar - Data Visualization with D3 - freeCodeCamp Tutorial

533 views

5 years ago

CultivateDev
FreeCodeCamp JavaScript (Legacy Curriculum) - Return Largest Numbers in Arrays

A coding tutorial for the Basic Algorithm Scripting section of FreeCodeCamp's legacy curriculum, JavaScript Algorithms and Data ...

2:12
FreeCodeCamp JavaScript (Legacy Curriculum) - Return Largest Numbers in Arrays

23 views

2 years ago

Ganesh H
6 - Change Styles Based on Data - Data Visualization with D3 - freeCodeCamp Tutorial

To dynamically changed styles, we can use a function as the value argument in the style method, which can take in an item from ...

3:11
6 - Change Styles Based on Data - Data Visualization with D3 - freeCodeCamp Tutorial

862 views

5 years ago

Ganesh H
24 - Create a Linear Scale with D3 - Data Visualization with D3 - freeCodeCamp Tutorial

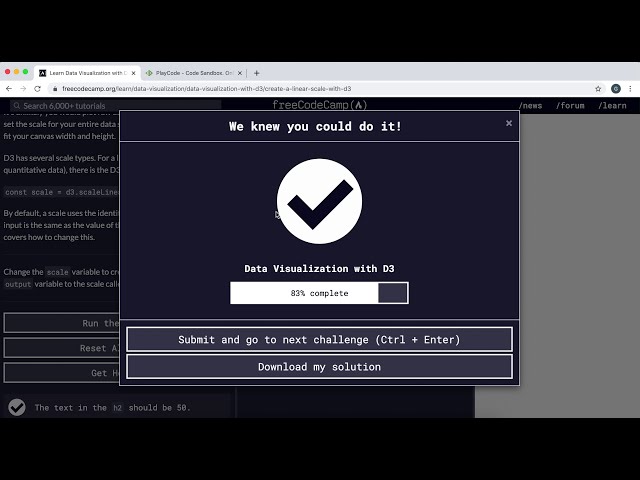
Linear Scales allow us to scale our SVG elements. This maintains the proportions of the graph and re-scales it when the ...

4:24
24 - Create a Linear Scale with D3 - Data Visualization with D3 - freeCodeCamp Tutorial

674 views

5 years ago

Ganesh H
27 - Use Dynamic Scales - Data Visualization with D3 - freeCodeCamp Tutorial

At 10:10, I meant to say set the HIGHEST value. We'll create two linear scales to dynamically scale the circles in a scatter plot.

10:37
27 - Use Dynamic Scales - Data Visualization with D3 - freeCodeCamp Tutorial

906 views

5 years ago

Ganesh H
22 - Add Attributes to the Circle Elements - Data Visualization with D3 - freeCodeCamp Tutorial

We're going to set the cx and cy attributes with the attribute method and using a callback function as the second argument to ...

3:23
22 - Add Attributes to the Circle Elements - Data Visualization with D3 - freeCodeCamp Tutorial

595 views

5 years ago

Ganesh H
2 - Select a Group of Elements - Data Visualization with D3 - freeCodeCamp Tutorial

This covers selecting multiple html elements with the d3 selectAll method, and returning them as an array to work with. Link to ...

1:54
2 - Select a Group of Elements - Data Visualization with D3 - freeCodeCamp Tutorial

754 views

5 years ago