Upload date
All time
Last hour
Today
This week
This month
This year
Type
All
Video
Channel
Playlist
Movie
Duration
Short (< 4 minutes)
Medium (4-20 minutes)
Long (> 20 minutes)
Sort by
Relevance
Rating
View count
Features
HD
Subtitles/CC
Creative Commons
3D
Live
4K
360°
VR180
HDR
682 results
excelshorts #excel #excelmis #exceltutorial #MIS MS Excel Excel Inertview questions and answers MS excel full course in hindi ...
0 views
6 days ago
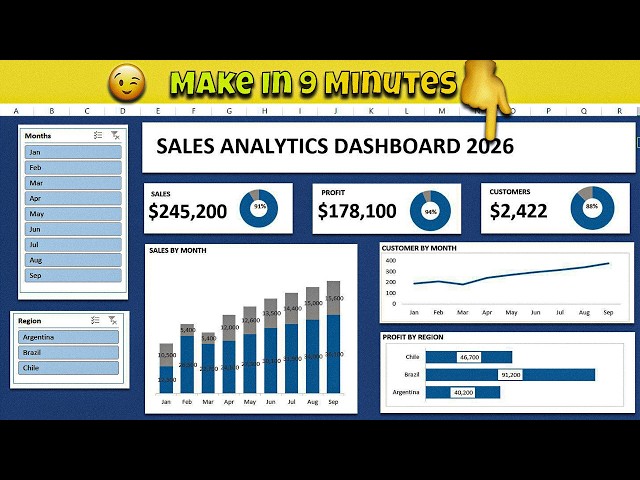
Learn how to create a professional and interactive Excel Sales Analytics Dashboard in just 9 minutes! This step-by-step tutorial ...
149 views
4 days ago
Data Analyst Masters Program (Discount Code - YTBE15) ...
392 views
2 days ago
Sponsored By TechLift Academy.
37 views
5 days ago
Conditional Formatting helps you understand Excel data at a glance. In this video, you'll learn how to use Icon Sets and Data Bars ...
2 views
14 hours ago
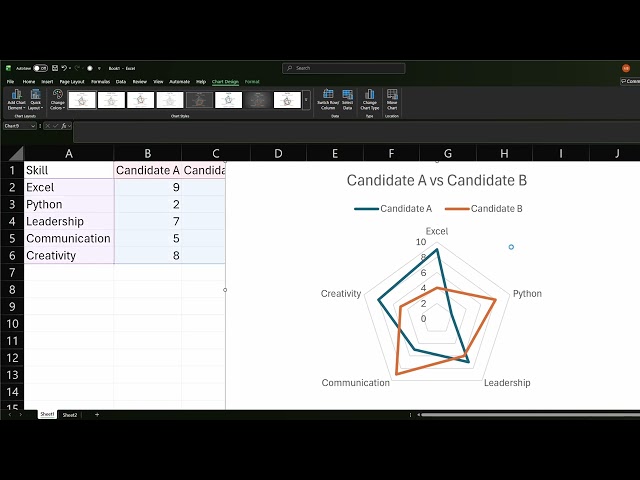
In this video, I walk you through exactly how to create a radar/spider chart and format it to look professional. CALCULATORS ...
In this video you will learn how to create and use a Pivot Table and Chart in Microsoft Excel. Learning how to use the PivotChart ...
65 views
3 days ago
Let's learn how to create graph and sparkline in excel.
50% OFF COUPON CODE: FEB50 ▶️https://courses.mellontraining.com/ ⬇️ Download the COMPLETE CALENDAR: ...
132 views
1 day ago
Analyzing Excel data and creating clear visualizations doesn't have to be complicated. In this video, you'll learn how to analyze ...
12 views
11 hours ago
excelvba #cateringservices #exceldashboard Download the Product Now: ...
853 views
Like | Comment | Subscribe for more Excel & Data Visualization tutorials #Excel #ExcelCharts #DataVisualization #Analytics ...
5,216 views
CALCULATORS | Amazon Affiliate Links Best Overall:TI-84 Plus CE (Approved for SAT/ACT/College Exams): ...
5 views
1,720 views
Streamed 1 day ago
hiData for Excel lets you understand your data just by asking questions. Type in plain English, and your spreadsheet turns into ...
63 views
The course covers essential BA tools, data visualization concepts, and real-world use cases to bridge the gap between business ...
350 views
10 hours ago
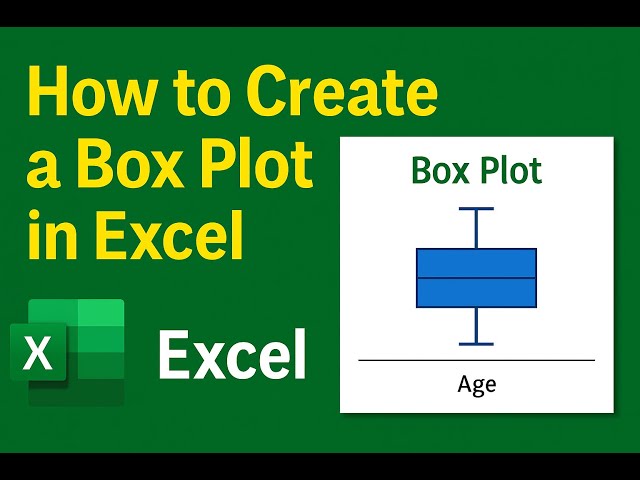
Learn how to create a box plot in Excel to visualize data distribution, spot outliers, and understand ranges. This step-by-step ...
29 views
7 days ago
Download the Practice Kit ⬇️ - https://goodly.co.in/you-dont-need-xlookup-and-vlookup/ Register for the Power BI Foundations ...
14,833 views
Choosing chart types in Excel ---------------------------------------------------------------- Welcome to our complete Microsoft Office tutorial ...
Learn how to create **Excel Sparklines** step by step! These mini charts are perfect for visualizing trends and patterns in your ...
6 views
![Tableau Data Visualization Full Course 2026 [FREE] | Data Visualization Using Tableau | Simplilearn](/api/proxy/image?url=https%3A%2F%2Fi.ytimg.com%2Fvi%2Fv4SpTOC4ZN0%2Fsddefault.jpg)


![Tableau Data Visualization Full Course 2026 [FREE] | Data Visualization Using Tableau | Simplilearn](/api/proxy/image?url=https%3A%2F%2Fi.ytimg.com%2Fvi%2F40tEqp7OdIM%2Fsddefault.jpg)

![Business Analysis With Excel Full Course 2026 [FREE] | Business Analytics With Excel | Simplilearn](/api/proxy/image?url=https%3A%2F%2Fi.ytimg.com%2Fvi%2Ff5HBk-qymWY%2Fsddefault.jpg)