ViewTube

ViewTube
Sign inSign upSubscriptions
Filters

Upload date

Type

Duration

Sort by

Features

Reset

3,156 results

Hydro-Morphodynamics
Python plotting with Matplotlib and Pandas

Get to know Python's matplotlib and pandas libraries for plotting your data based on materials provided at ...

36:12
Python plotting with Matplotlib and Pandas

75 views

3 years ago

CampusX
Session 23 - Plotting using Matplotlib | DSMP 2022-23

Data Science Mentorship Program (DSMP) 2022-23 Enroll in this Programme from our Website - https://learnwith.campusx.in/ ...

2:06:30
Session 23 - Plotting using Matplotlib | DSMP 2022-23

114,970 views

Streamed 3 years ago

Susam Pal
A Tour of Matplotlib: From Bar Charts to XKCD-Style Plots - Susam Pal - PyCon UK 2019

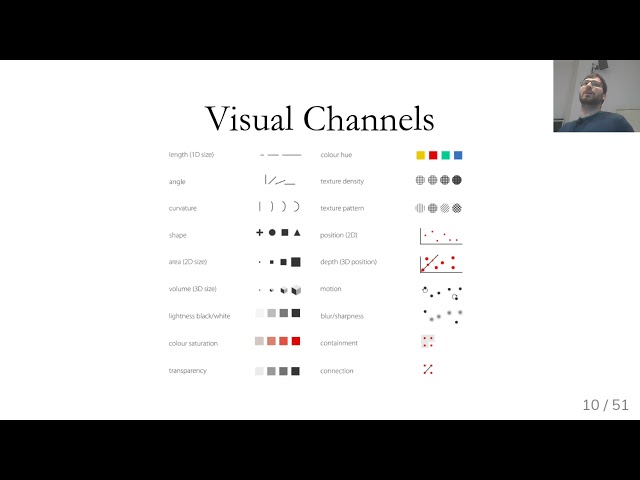
A Tour of Matplotlib: From Bar Charts to XKCD-Style Plots PyCon UK 2019, Cardiff City Hall, Cardiff, UK (15 Sep 2019) Slides: ...

25:33
A Tour of Matplotlib: From Bar Charts to XKCD-Style Plots - Susam Pal - PyCon UK 2019

105 views

5 years ago

EuroSciPy
EuroSciPy 2017: Matplotlib

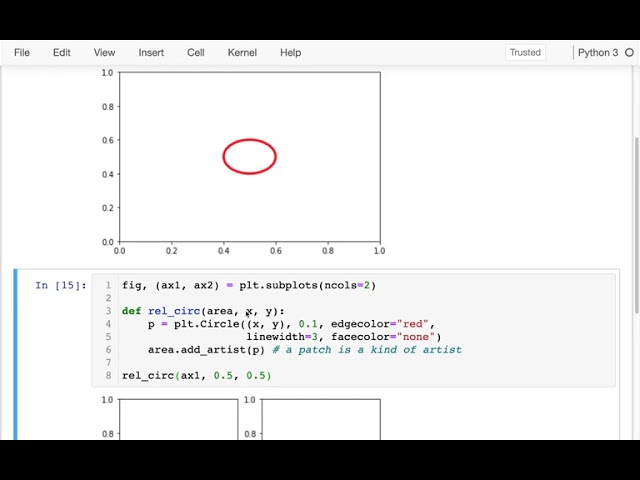
Presenter: Mike Müller.

1:27:32
EuroSciPy 2017: Matplotlib

662 views

8 years ago

Creative Common lisence
Data Visualization with matplotlib  Matplotlib Tutorial

In this course you will learn how to visualize data with python matplotlib library. #Matplotlib is very powerful python library that can ...

52:46
Data Visualization with matplotlib Matplotlib Tutorial

6 views

4 years ago

CampusX
Session 24 - Advanced Matplotlib | DSMP 2022-23

Data Science Mentorship Program (DSMP) 2022-23 Enroll in this Programme from our Website - https://learnwith.campusx.in/ ...

2:13:23
Session 24 - Advanced Matplotlib | DSMP 2022-23

66,718 views

Streamed 3 years ago

Tyler Caraza-Harter
CS 320 Oct 28 (Part 1) - Matplotlib Coordinate Systems

... one of these tools um let me give you an example of that maybe something that wouldn't be so easy to do in matplotlib um here i ...

22:13
CS 320 Oct 28 (Part 1) - Matplotlib Coordinate Systems

396 views

5 years ago

The Life Code
Data Visualization with Matplotlib

This tutorial will teach you hands-on practice on generating visualizations in Python with Matplotlib and also intuitively use.

1:27:29
Data Visualization with Matplotlib

47 views

3 years ago

TokyoEdtech
Python Coding Tutorial: matplotlib & pyplot Introduction

In this video I walk through a simple example of how to install and use the matplotlib libary to make simple charts ...

22:51
Python Coding Tutorial: matplotlib & pyplot Introduction

1,022 views

5 years ago

Andreas Mueller
Applied ML 2020 - 02 Visualization and matplotlib

Course materials at https://www.cs.columbia.edu/~amueller/comsw4995s20/schedule/

1:07:31
Applied ML 2020 - 02 Visualization and matplotlib

16,256 views

6 years ago

Adam Gaweda, Dr. Sensei
Simulating Infection Spread with Matplotlib - Changing Colors in a Matplotlib Scatterplot Animation

... i'm importing matplotlib i'm importing a subplot or subportion of matplotlib again instead of being pie plots i'm actually importing ...

23:39
Simulating Infection Spread with Matplotlib - Changing Colors in a Matplotlib Scatterplot Animation

342 views

4 years ago

Learn {to} Code
Data Visualization using Matplotlib

Learn how to use Python to create charts and data visualizations. Create complex data visualizations using Matplotlib. Create ...

1:39:10
Data Visualization using Matplotlib

78 views

3 years ago

Codanics
Data Visualization Masterclass in Python | Matplotlib, Seaborn & Plotly for Beginners to Advanced

Video Description: Master Data Visualization with Python: From Beginner to Advanced! In this comprehensive Data ...

5:27:54
Data Visualization Masterclass in Python | Matplotlib, Seaborn & Plotly for Beginners to Advanced

36,930 views

1 year ago

kritik sah
Data Visualization with matplotlib || Matplotlib Tutorial

In this course you will learn how to visualize data with the python matplotlib library. #Matplotlib is a very powerful python library ...

52:46
Data Visualization with matplotlib || Matplotlib Tutorial

8 views

4 years ago

Townview Machine Learning and AI
Intro to Matplotlib (Meeting 10)

Broadcasted live on Twitch -- Watch live at https://www.twitch.tv/townviewml This was our tenth meeting. We started our lesson on ...

41:35
Intro to Matplotlib (Meeting 10)

14 views

5 years ago

Tutorialistic
Data Visualization with Matplotlib  || Matplotlib Tutorial

In this course you will learn how to visualize data with python matplotlib library. #Matplotlib is very powerful python library that can ...

52:46
Data Visualization with Matplotlib || Matplotlib Tutorial

9 views

3 years ago

PyCon Hong Kong
PyCon HK 2017 - Matplotlib 2 By Example

PyCon Hong Kong 2017 Workshop Matplotlib 2 By Example - by Claire Chung The workshop aims to discuss the methods and ...

46:31
PyCon HK 2017 - Matplotlib 2 By Example

194 views

Streamed 8 years ago

The Life Code
Data Visualization in Python with Matplotlib and Numpy

Learn about Data Visualization fundamentals in Python using Matplotlib and Numpy Seaborn Heatmap Tutorial | Python Data ...

1:17:04
Data Visualization in Python with Matplotlib and Numpy

247 views

3 years ago

Adam Burgasser
Cool Star Lab Summer Workshops #4: Matplotlib & Pandas

In this online workshop, Christian Aganze and Adam Burgasser present the basics of using the packages Matplotlib (data ...

2:00:06
Cool Star Lab Summer Workshops #4: Matplotlib & Pandas

76 views

2 years ago

Involcan Iter
Basic scientific plotting in Python: Matplotlib

Writing the code shorter so instead of using each time matplotlib dot by plot we can just replace it by with PLT so it's just easier ...

28:18
Basic scientific plotting in Python: Matplotlib

177 views

6 years ago