Upload date
All time
Last hour
Today
This week
This month
This year
Type
All
Video
Channel
Playlist
Movie
Duration
Short (< 4 minutes)
Medium (4-20 minutes)
Long (> 20 minutes)
Sort by
Relevance
Rating
View count
Features
HD
Subtitles/CC
Creative Commons
3D
Live
4K
360°
VR180
HDR
2,756,540 results
Effective data visualisation comes in many shapes and sizes, but how do you move away from a standard bar chart? Watch the ...
78,823 views
4 years ago
Links mentioned in this video ⬇️ Exercise File ...
249,462 views
2 years ago
This comprehensive tutorial will teach you everything you need to know about Excel chart types, chart customization, and creating ...
110,263 views
1 year ago
"️ IBM - Data Analyst ...
319,845 views
8 years ago
Download the free course files and follow along here: ➡️https://www.simonsezit.com/charts-and-dashboards-in-excel-demo-files ...
12,684 views
Learn data visualization with D3.js. D3 is a JavaScript library for manipulating documents based on data. D3 helps you bring data ...
364,751 views
3 years ago
Watch this mini-workshop delivered by best-selling author Cole Nussbaumer Knaflic. Cole demonstrates how to transform graphs ...
333,514 views
Streamed 2 years ago
Data storytelling is one of the most important skills for any data professional. Those who do it effectively can drive serious impact ...
23,111 views
Learn Data Visualization with D3, JavaScript, and React. Part 2: https://youtu.be/H2qPeJx1RDI Created by @currankelleher .
519,344 views
5 years ago
Use the code "DATA" to get 25% off The Big Nodebook!!! https://mtranimationgumroad.gumroad.com/l/thebignodebook/DATA Use ...
100,542 views
6 months ago
In this talk, I will chart the course of visual depictions of data over the last 200 years, from the classic data graphics of Playfair and ...
19,098 views
Join my Academy, learn Data & AI skills and land a job https://analyticsautomation.academy/ Mind map available here ...
4,755 views
4 months ago
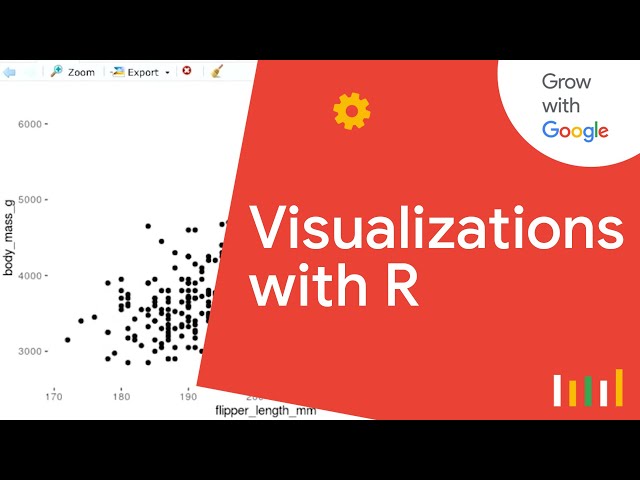
Dataviz is easy with R and ggplot. Give me half and hour and I'll show you all the basics and more! If this vid helps you, please ...
63,343 views
http://www.ted.com David McCandless turns complex data sets (like worldwide military spending, media buzz, Facebook status ...
401,838 views
15 years ago
Learn how to use code to visualize your data. Data visualization is one of the most important parts of data analysis. Powerful ...
87,084 views
Learn the basics of Python, Numpy, Pandas, Data Visualization, and Exploratory Data Analysis in this course for beginners.
3,194,443 views
Excel Data Analysis Full Course Tutorial (7+ Hours) Get Ad-Free Training by becoming a member today!
1,869,259 views
IBM - Data Analyst ...
73,483 views
Streamed 4 years ago
Python data analysis / data science tutorial. Let's go! For more videos like this, I'd recommend my course here: ...
1,532,112 views
7 years ago
Learn to use Tableau to produce high quality, interactive data visualizations! Tableau can help you see and understand your data.
919,333 views