Upload date
All time
Last hour
Today
This week
This month
This year
Type
All
Video
Channel
Playlist
Movie
Duration
Short (< 4 minutes)
Medium (4-20 minutes)
Long (> 20 minutes)
Sort by
Relevance
Rating
View count
Features
HD
Subtitles/CC
Creative Commons
3D
Live
4K
360°
VR180
HDR
3,147 results
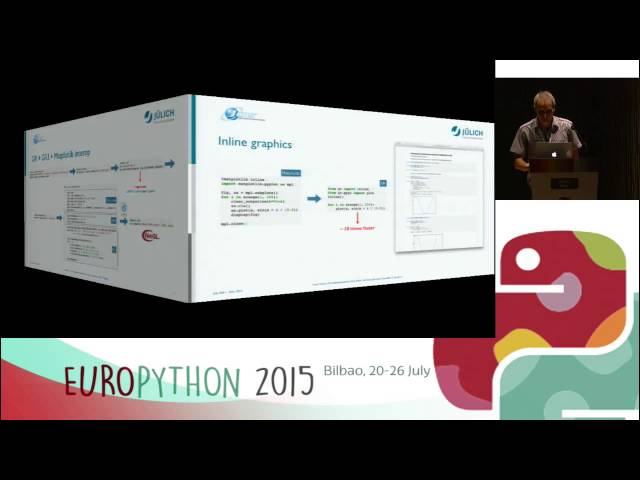
Josef Heinen - Getting more out of Matplotlib with GR [EuroPython 2015] [20 July 2015] [Bilbao, Euskadi, Spain] Python is well ...
575 views
10 years ago
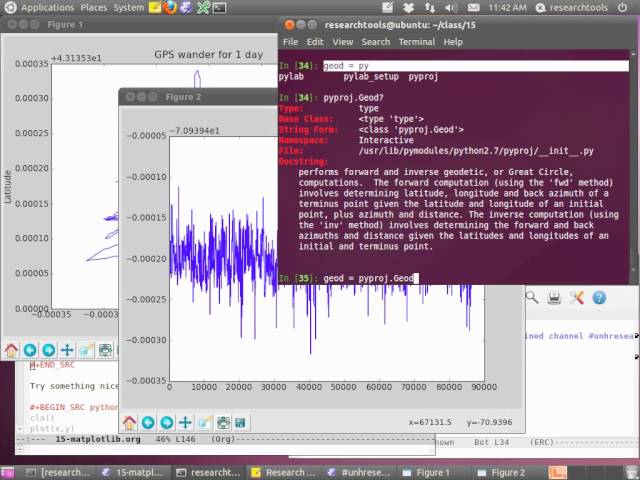
... i'm importing matplotlib i'm importing a subplot or subportion of matplotlib again instead of being pie plots i'm actually importing ...
342 views
4 years ago
Data Science Mentorship Program (DSMP) 2022-23 Enroll in this Programme from our Website - https://learnwith.campusx.in/ ...
113,213 views
Streamed 3 years ago
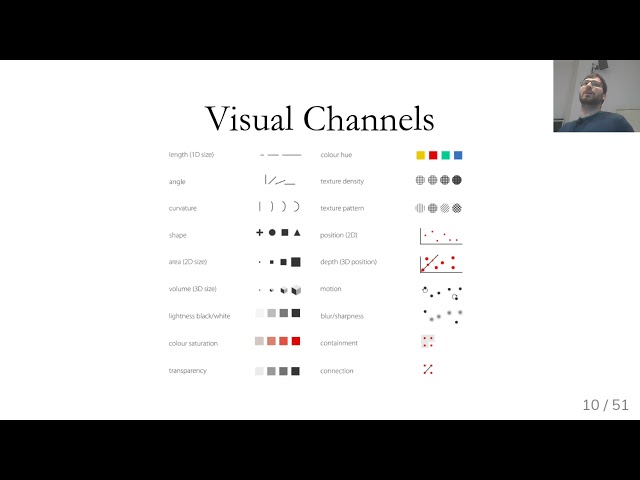
Course materials at https://www.cs.columbia.edu/~amueller/comsw4995s20/schedule/
16,236 views
6 years ago
65,700 views
Presenter: Mike Müller.
662 views
8 years ago
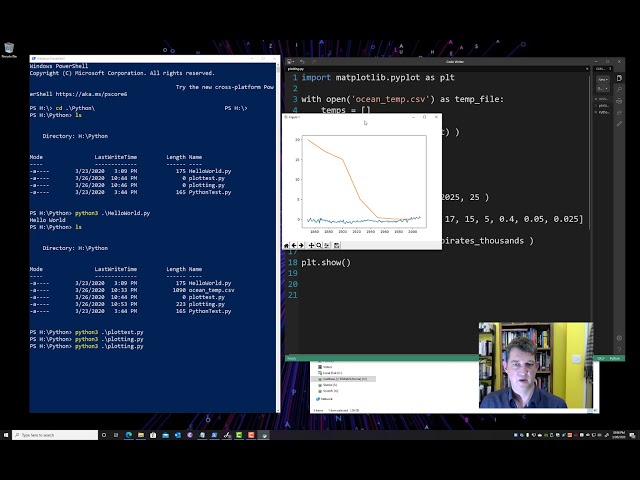
In this video we're gonna take a look at how to plot data using matplotlib so the first thing I do is pick up where we left off before ...
56 views
5 years ago
Introduction to plotting / graphing with matplotlib and numpy from withing ipython using the --pylab option. Simple line, xy, and ...
11,036 views
14 years ago
Get to know Python's matplotlib and pandas libraries for plotting your data based on materials provided at ...
75 views
3 years ago
In this course you will learn how to visualize data with python matplotlib library. #Matplotlib is very powerful python library that can ...
6 views
Learn how to use Python to create charts and data visualizations. Create complex data visualizations using Matplotlib. Create ...
78 views
This tutorial will teach you hands-on practice on generating visualizations in Python with Matplotlib and also intuitively use.
47 views
Video Description: Master Data Visualization with Python: From Beginner to Advanced! In this comprehensive Data ...
36,508 views
1 year ago
Broadcasted live on Twitch -- Watch live at https://www.twitch.tv/townviewml This was our tenth meeting. We started our lesson on ...
14 views
9 views
Beginning matplotlib using loadtxt from numpy to bring in CSV text data saved as a bzip2 compressed file to save space. Using a ...
1,493 views
13 years ago
In this course you will learn how to visualize data with the python matplotlib library. #Matplotlib is a very powerful python library ...
8 views
We are creating a visualization series with Python programming language and the lesson shared in this video is part of that series.
148 views
A Tour of Matplotlib: From Bar Charts to XKCD-Style Plots PyCon UK 2019, Cardiff City Hall, Cardiff, UK (15 Sep 2019) Slides: ...
103 views
BIDS Data Science Lecture Series | September 4, 2015 | 1:00-2:30 p.m. | 190 Doe Library, UC Berkeley Speaker: Nathaniel Smith, ...
1,941 views
Streamed 10 years ago