Upload date
All time
Last hour
Today
This week
This month
This year
Type
All
Video
Channel
Playlist
Movie
Duration
Short (< 4 minutes)
Medium (4-20 minutes)
Long (> 20 minutes)
Sort by
Relevance
Rating
View count
Features
HD
Subtitles/CC
Creative Commons
3D
Live
4K
360°
VR180
HDR
1,958 results
Rotational motion is full of scary equations and strange symbols... what do they all mean? Indeed, can the complex math that ...
431,226 views
1 year ago
You can try to read math textbooks the way you might read People magazine (scanning the words and hoping for the best), but ...
58 views
3 years ago
https://www.youtube.com/watch?v=WcNiA06WNvI&list=PLTjLwQcqQzNKzSAxJxKpmOtAriFS5wWy4 Theoretical Physics Book: ...
370,136 views
5 years ago
The Illustrating Math program at PCMI Plenary Address Topic: Visualization for research and exposition Speaker: Ingrid ...
246 views
4 years ago
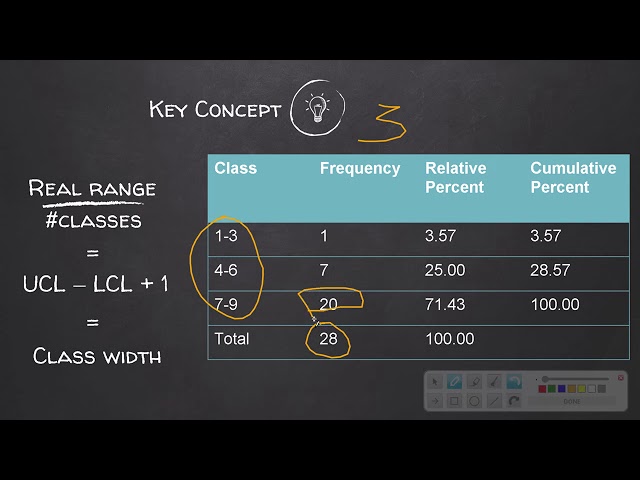
0:00 - Intro 0:17 - Frequency 0:50 - Distributions 1:30 - Frequency Tables 2:15 - Grouped & Ungrouped Data 2:55 - Grouped ...
347 views
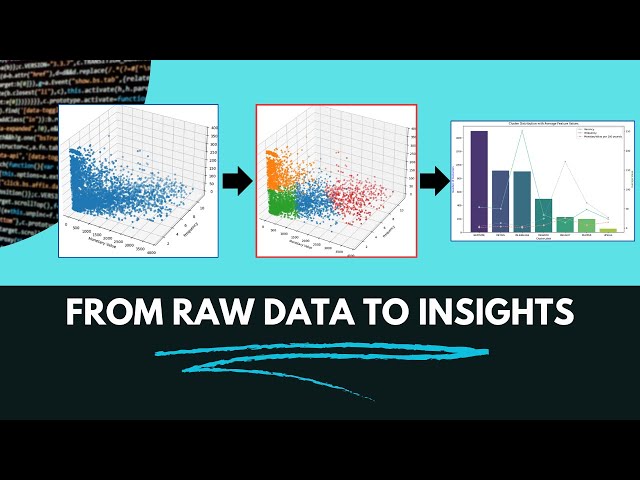
A review of two matrix-like plots made with R using two breast cancer datasets. Shows how to read and interpret the small ...
239 views
888 views
Um Hello Um I I I just want to ask um since you're um discussing mathematical visualizations in manim um does manim integrate ...
53 views
9 months ago
A tutorial on how to make a Parallel Coordinates graph in R, based on Chapter 7: Spotting Differences, in the book Visualize This ...
4,131 views
11 years ago
Try CodeCrafters for free using my referral link: https://app.codecrafters.io/join?via=trentpark8800 In this walkthrough, we dive into ...
89,097 views
Time after time, I have felt that my artistic contribution has been not so much to create a particular digital image, but rather to ...
688 views
7 years ago
https://www.https://www.youtube.com/watch?v=hJD8ywGrXks&list=PLTjLwQcqQzNKzSAxJxKpmOtAriFS5wWy4 Theoretical ...
826,390 views
6 years ago
... multi-player game featuring the very latest in mathematical visualizations and graphics. Special introduction by private astronaut ...
721 views
8 years ago
... z suddenly argon what created the geometric meaning for those numbers the mind could visualize them and that's key because ...
3,109 views
10 years ago
This video covers methods of visualizing quantitative data including histograms and stem and leaf plots.
201 views
8 months ago
See http://wiki.wstein.org/edu/2012/480 and http://480.sagenb.org/home/pub/111/
698 views
13 years ago
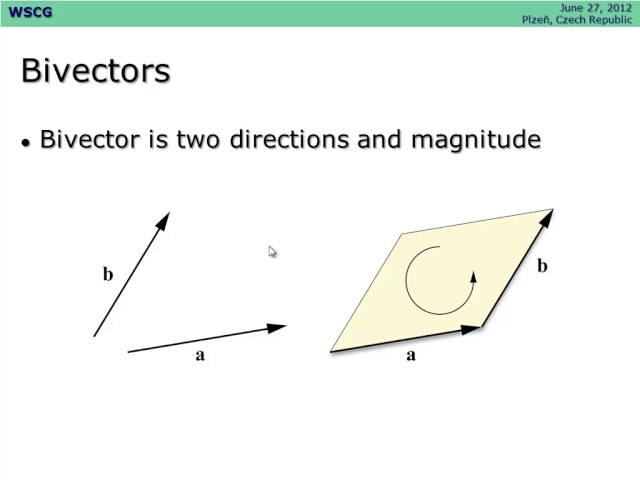
Slideshow & audio of Eric Lengyel's keynote in the 2012 WSCG conference in Plzeň, Czechia, on geometric algebra for computer ...
24,458 views
Living in a three-dimensional environment, we're all very good at visualizing two- and three-dimensional objects. But how can we ...
1,900 views
This full course provides a complete introduction to Graph Theory algorithms in computer science. Knowledge of how to create ...
512 views
2 years ago
Data Visualization with Python. Learn Matplotlib, Numpy, line plot, bar plot, scatter plot, histogram, data set, and distribution ...
38 views