Upload date
All time
Last hour
Today
This week
This month
This year
Type
All
Video
Channel
Playlist
Movie
Duration
Short (< 4 minutes)
Medium (4-20 minutes)
Long (> 20 minutes)
Sort by
Relevance
Rating
View count
Features
HD
Subtitles/CC
Creative Commons
3D
Live
4K
360°
VR180
HDR
91,387 results
I'm very excited to welcome our next team talk uh from the amazing bloomberg visual data team i'm so excited to have him here ...
656 views
11 years ago
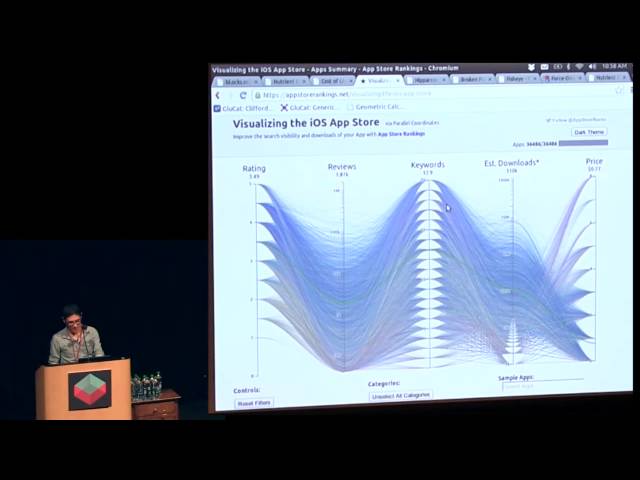
We will explore datasets like these by interacting with parallel coordinates: discovering relationships, identifying outliers, and ...
25,967 views
12 years ago
Whenever we see or generate a data visualization it's important that we review what does and doesn't work in the visual. In this ...
1,854 views
4 years ago
NYC Open Data Week 2022 - Mar 12 2022 Have you ever felt trapped by only having a few chart types to choose from in your ...
67 views
3 years ago
CMU Database Group - Vaccination Database Tech Talks - Booster (2022) Speakers: Vishakha Gupta (ApertureDB) March 7, ...
1,403 views
Presented by Jeff Hemsley, Associate Professor & Director of the Center for Computational & Data Science (CCDS) at the ...
2,907 views
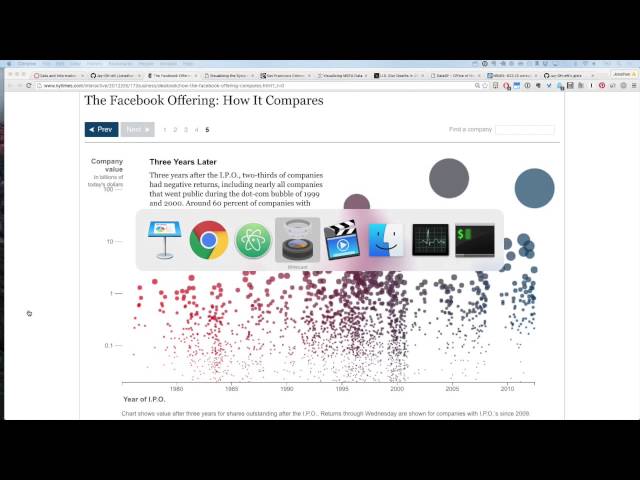
Recordings from the University of San Francisco's Spring 2016 MSAN 622 course: Introduction to Data and Information ...
426 views
9 years ago
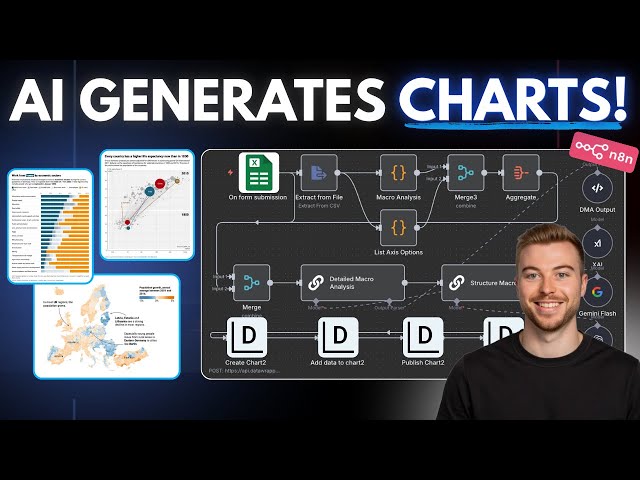
Access AI blueprints, tutorials, tools & expert help to level up fast! https://bit.ly/4lV67U2 Links Mentioned: - ⚡️ n8n: ...
2,142 views
6 months ago
WordPress 4.7's integrated REST API just gave us easy access to the public data of millions of sites. We, as designers, can now ...
60 views
7 years ago
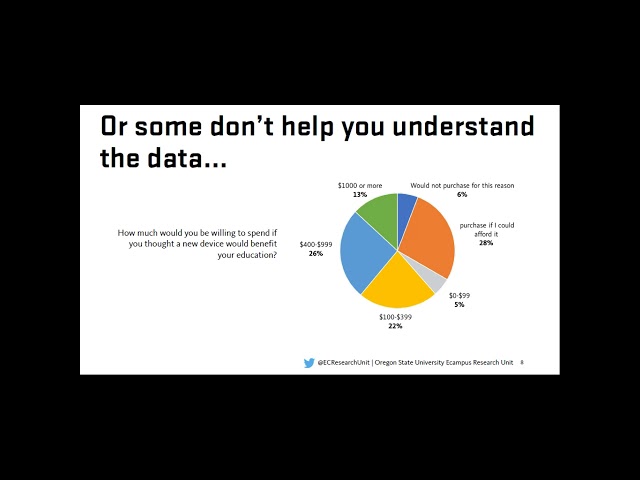
Presenters: Amy Donley & Dr. Mary Ellen Dello Stritto Date: Thursday, October 17 • 9:40am - 10:40am Data Visual Literacy: What ...
31 views
6 years ago
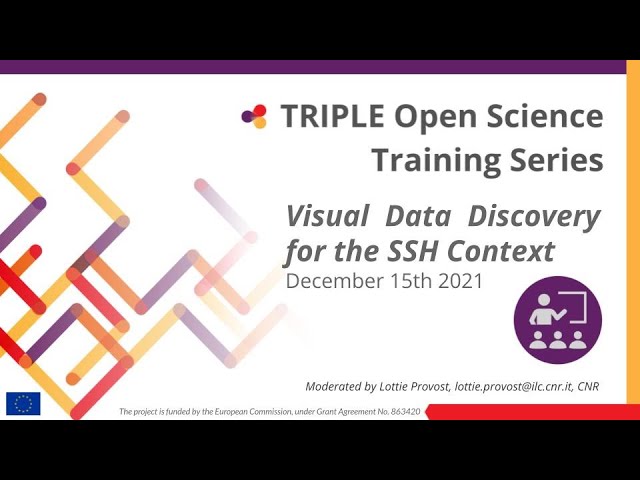
This training event is devoted specifically to the visual discovery of research resources with the GoTriple platform, which is ...
82 views
This applied webinar explores best practices for communicating open educational data with a wide audience. Topics include ...
641 views
Libraries have long collected data and aspired to present this information in a compelling and clear manner. In this session, the ...
379 views
10 years ago
Shaunna Morrison, Carnegie Institution for Science (USA) Ahmed Eleish, Rennselear Polytechnic Institute (USA) Discover how to ...
1,277 views
8 years ago
OpenVis Conf April 25th-26th, 2016 Interact with this and other talk videos on http://openvisconf.com/ Follow us on Twitter for more ...
4,203 views
Jasiek Krzysztofiak is an award-winning information designer, working as Senior Art Editor for the science journal Nature in ...
64 views
1 year ago
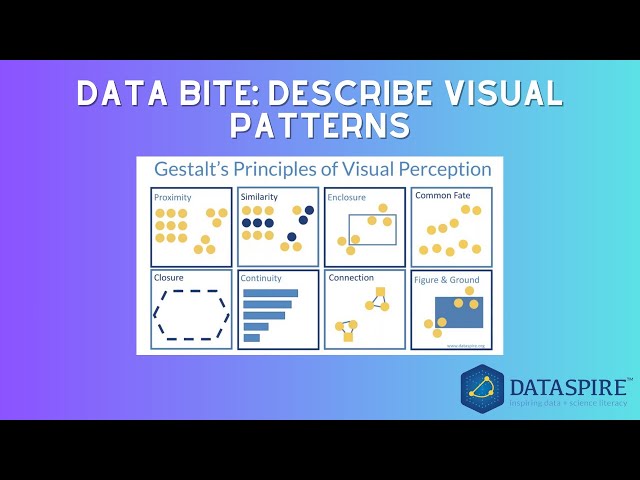
How can we help learners get better at describing visual patterns in data? Here we explore five common data patterns to help ...
74 views
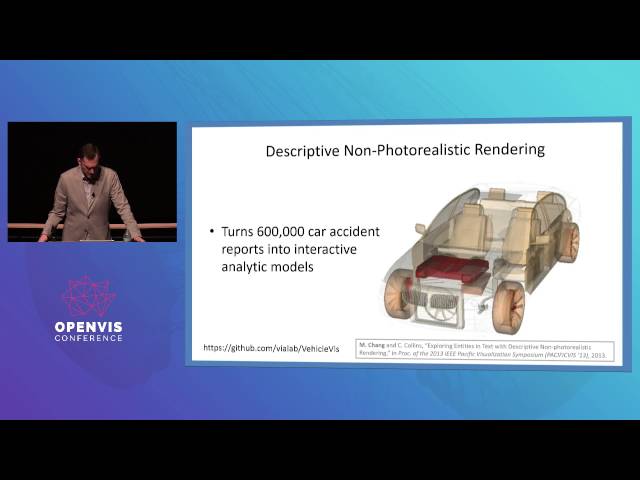
Abstract: Text is one of the most prominent forms of open data available, from social media to legal cases. Text visualizations are ...
725 views
Many STL classes have complicated representations. To make debugging easier, Visual Studio 2005 and 2008 contained ...
1,498 views
In visual analysis, I'm answering four different questions. Are the data divided? Are they stable? Am I convinced by the data?
4,497 views
5 years ago