Upload date
All time
Last hour
Today
This week
This month
This year
Type
All
Video
Channel
Playlist
Movie
Duration
Short (< 4 minutes)
Medium (4-20 minutes)
Long (> 20 minutes)
Sort by
Relevance
Rating
View count
Features
HD
Subtitles/CC
Creative Commons
3D
Live
4K
360°
VR180
HDR
124,567 results
Presented: April 12, 2018 Transcript: ...
4,707 views
7 years ago
Multiplicity - an online stocks and flows data gathering and visualisation platform (Paul Hoekman, Co-founder Metabolism of ...
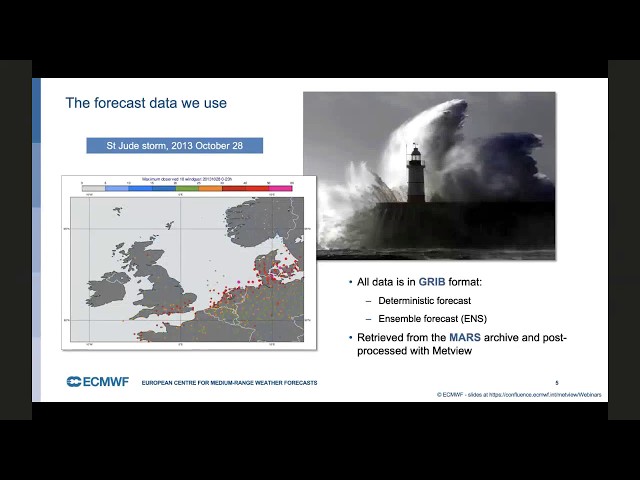
55 views
6 years ago
This webinar will show how Metview can be used to process and visualise ensemble data from ECMWF. Computations such as ...
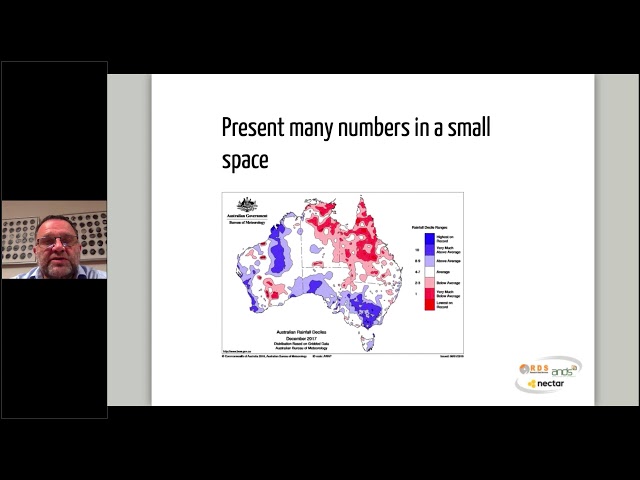
1,624 views
5 years ago
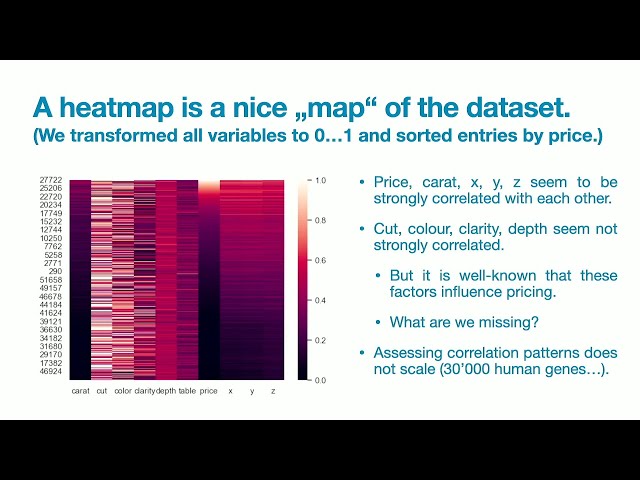
A good data visualisation does not only convert large amounts of data into images, but when done well, it engages the viewer and ...
6,423 views
manifestlove #howtoattractlove #mindfuldating Hello :) I'm Monika and I created this Guided Visualisation To Attract Your ...
1,939 views
4 years ago
This is a relaxation and visualization exercise to prepare Alba Weinman's clients for their own hypnosis session with her.
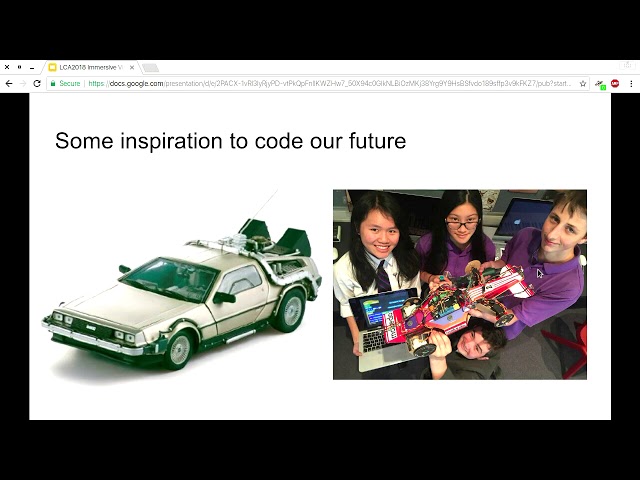
106,350 views
8 years ago
Roland Gesthuizen http://lca2018.linux.org.au/schedule/presentation/188/ Keynote: Immersive Visualisation at the Monash Cave ...
61 views
Hidden patterns are all around us — but they often stay buried within raw data. This talk explores how clever data visualisation ...
1,728 views
6 months ago
Block H of the Geographic Data Science course - "Points" More materials related to the content in this video are available at: ...
468 views
The late brother Dave Hunt delivers a powerful message on visualization and imagination.
12,234 views
Click the Link below : https://mindandgutwellness.com/ Send Whatsapp message ''Hello"' To 7039111233 Click the Link below ...
68,511 views
5 months ago
Martin Jucker (UNSW) gives an overview of using Paraview to visualise climate datasets.
311 views
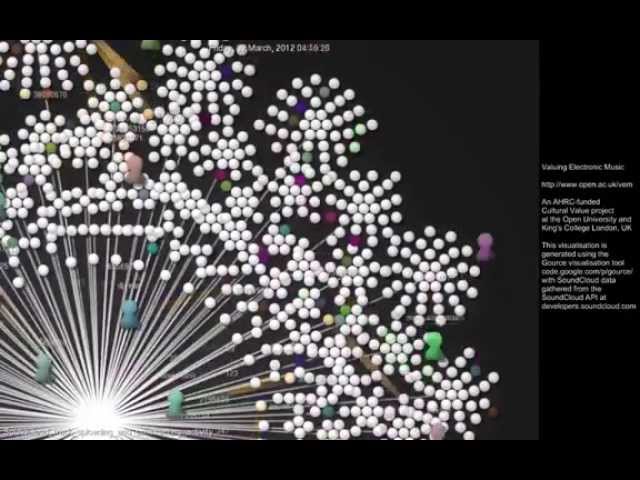
This visualisation is created as part of the Valuing Electronic Music project funded by AHRC at CeRch (KCL) and at the Open ...
267 views
11 years ago
https://media.ccc.de/v/gpn23-98-patterns-in-chaos-how-data-visualisation-helps-to-see-the-invisible Hidden patterns are all ...
1,093 views
7 months ago
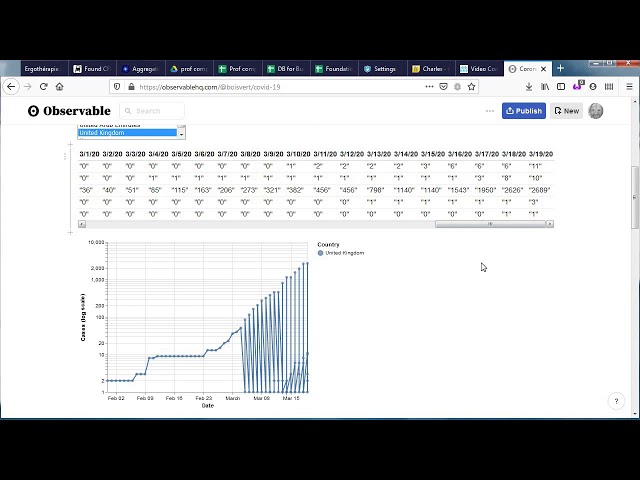
License: CC-BY-SA https://creativecommons.org/licenses/by-sa/4.0/ An example (with live data of the pandemic) of preparing and ...
1,465 views
This is the fourth of a series of workshops on R offered by the AI for Multiple Long-term Conditions Research Support Facility in ...
124 views
3 years ago
This is a talk I gave internally at Data61 about the principles of data visualisation. There is a bit of creativity, a bit of psychology, ...
120 views
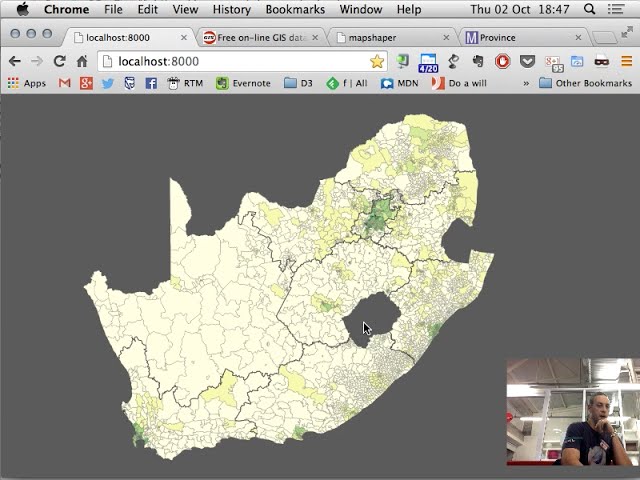
This is the recording from the Data Visualisation Meetup group held on the 2 Oct 2014.
72 views
https://media.ccc.de/v/2025-475-patterns-in-chaos-how-data-visualisation-helps-to-see-the-invisible Full transparency in the ...
1,236 views
Speaker: Prof. Maxine D. Brown, Electronic Visualization Laboratory, University of Illinois at Chicago Abstract: Today, most ...
57 views
9 years ago