Upload date
All time
Last hour
Today
This week
This month
This year
Type
All
Video
Channel
Playlist
Movie
Duration
Short (< 4 minutes)
Medium (4-20 minutes)
Long (> 20 minutes)
Sort by
Relevance
Rating
View count
Features
HD
Subtitles/CC
Creative Commons
3D
Live
4K
360°
VR180
HDR
1,230 results
There a lot of ways that you can analyze data in Databricks! In this lesson we are going to be analyzing and visualizing data in ...
12,872 views
2 months ago
Discover how to unleash the full potential of Databricks Dashboards and turn your data into actionable insights! In this video, I'll ...
19,262 views
1 year ago
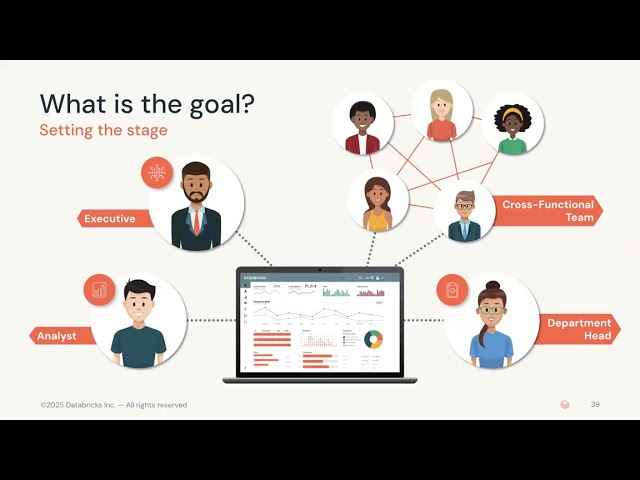
In this session, we will explain the visualizations that serve to shorten the time to insight for our prospects and encourage potential ...
714 views
2 years ago
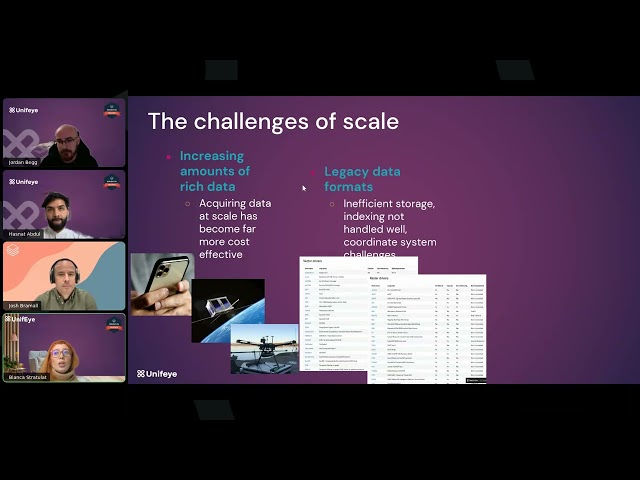
Most organizations capture huge volumes of spatial data, including addresses, coordinates, routes, and catchments, but struggle ...
123 views
3 months ago
In this video we will see how to create interactive reports on top of Databricks data. It's a simple yet realistic example of reporting in ...
140 views
1 month ago
S&P Global and Databricks jointly hosted a webinar to dive deeper into how S&P Global has applied large-scale geospatial map ...
916 views
Welcome back to Data Master — your home for mastering Databricks across all data platforms. In this video, let's dive deep into ...
3,549 views
Azure Databricks | AIBI Dashboards | Consumer Access in Databricks Video explains - What is AIBI Dashboards in Databricks?
4,041 views
6 months ago
In this video, you will learn how to use Unity Catalog, Databricks SQL, AI/BI Dashboards and AI/BI Genie to democratize analytics ...
12,329 views
10 months ago
This session explains the process of building interactive analytics with Databricks Dashboards.
2,157 views
The need for cost-effective, responsive, and timely big data visualization for public health purposes is paramount.
451 views
Documentation Chapters 00:00 Introduction to AI/BI: Dashboards, Genie, and Unity Catalog Governance 01:30 Advantages of ...
546 views
In this presentation, we will explore how to leverage Databricks' SQL engine to efficiently ingest and transform geospatial data.
478 views
7 months ago
In this video, we delve into creating and managing dashboards in Databricks. Starting with an introduction to dashboard features, ...
4,167 views
Discover Landmark's journey in large-scale spatial data analysis and visualization, where Databricks and CARTO seamlessly ...
444 views
This is the second workshop in a three-part series covering Data Analytics on Databricks. This workshop will demonstrate how to ...
110 views
5 months ago
Databricks just released a new AI-powered BI tool—and in this video, we put it to the test in a complete review of Databricks AI/BI!
2,053 views
Streamed 8 months ago
You have probably used the Databricks Notebook SQL output plot visualizations. But did you know you can also use it with Python ...
4,781 views
5 years ago
Data scientists face numerous challenges throughout the data science workflow that hinder productivity. As organizations ...
9,994 views
4 years ago
At Uber, location data is our biggest asset. How do we create data visualizations with rich location data, render a million points of ...
30,939 views
7 years ago