Upload date
All time
Last hour
Today
This week
This month
This year
Type
All
Video
Channel
Playlist
Movie
Duration
Short (< 4 minutes)
Medium (4-20 minutes)
Long (> 20 minutes)
Sort by
Relevance
Rating
View count
Features
HD
Subtitles/CC
Creative Commons
3D
Live
4K
360°
VR180
HDR
3,101 results
https://media.ccc.de/v/ASG2018-213-a_debugger_from_scratch At some stage in your programming life you may well have used ...
7,140 views
7 years ago
Presentation Slides, PDFs, Source Code and other presenter materials are available at: https://github.com/CppCon/CppCon2017 ...
2,782 views
8 years ago
http://CppCon.org — Presentation Slides, PDFs, Source Code and other presenter materials are available at: ...
31,003 views
We introduce you to new Microsoft Edge features, JSON Viewer and Focus Mode, and explore new Edge DevTools. We also ...
1,488 views
2 years ago
https://www.youtube.com/playlist?list=PL96F5PDvO1HHuVewlKWQDzzTUrhMm-wGS Update - Thank you to Mark Russinovich ...
6,752 views
Meet the Scrutiny Debugger! 🛠️ Pier-Yves Lessard joins The IoT Show to demonstrate his open-source tool that is changing ...
6,197 views
2 months ago
A good way to start investigating performance issues in your app is to understand its CPU usage. Profiler PM Esteban Herrera ...
31,669 views
5 years ago
Learn about the tools that security, developer, and IT professionals rely on to analyze, diagnose, troubleshoot, and optimize ...
75,014 views
4 years ago
Explore how Xcode can help you take your Metal debugging, profiling and asset creation workflows to the next level. Discover the ...
1,520 views
1 year ago
Learn how to design great software in 7 steps: https://arjan.codes/designguide. Setting up VSCode for Python development ...
144,718 views
Software-in-the-Loop (SIL) and Hardware-in-the-Loop (HIL) are two powerful concepts for system-level tests of your embedded ...
4,029 views
MIT 6.0001 Introduction to Computer Science and Programming in Python, Fall 2016 View the complete course: ...
195,359 views
9 years ago
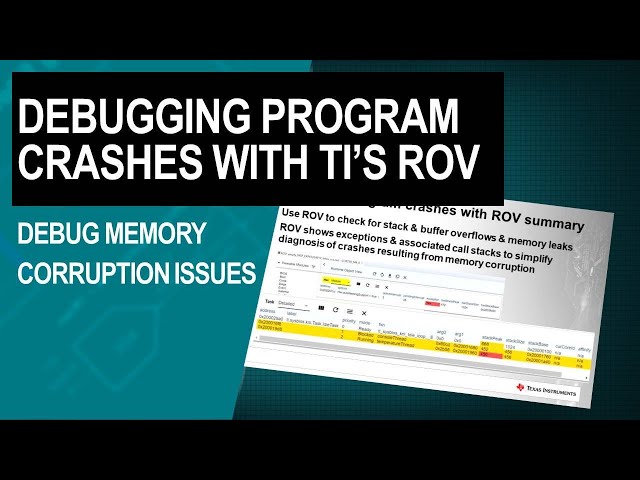
Download the CC1312 SimpleLink SDK https://www.ti.com/tool/SIMPLELINK-CC13X2-26X2-SDK This video shows how to use ...
1,474 views
6 years ago
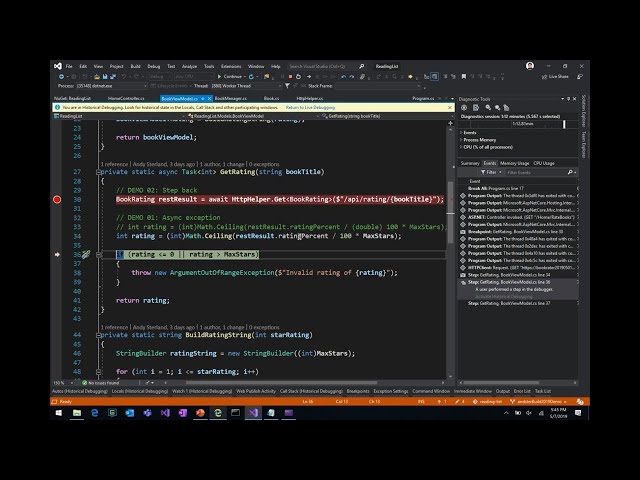
Check out how you can use the debugger and profiling tools in Visual Studio 2019 more effectively on their projects via demos ...
67,531 views
It's been an invaluable debugging tool for software developers and escalation engineers within Microsoft for many years. We've ...
20,953 views
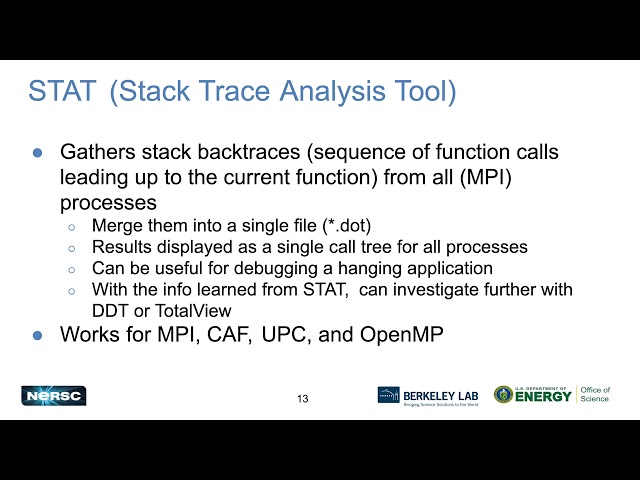
Part of the New User Training and Updated Best Practices on Perlmutter: February 15-16, 2024 Please see ...
94 views
ProcDump is a command-line utility that monitors an application for CPU spikes and generates crash dumps during a spike that ...
14,371 views
Making mistakes when programming is simply part of the process. In this video, Carlos will teach us several different ways to ...
15,404 views
Level up your debugging skills with Visual Studio's most powerful and underused features. This demo-packed session shows how ...
1,599 views
10 months ago
Part of the NERSC New User Training on June 16, 2020. Please see ...
203 views
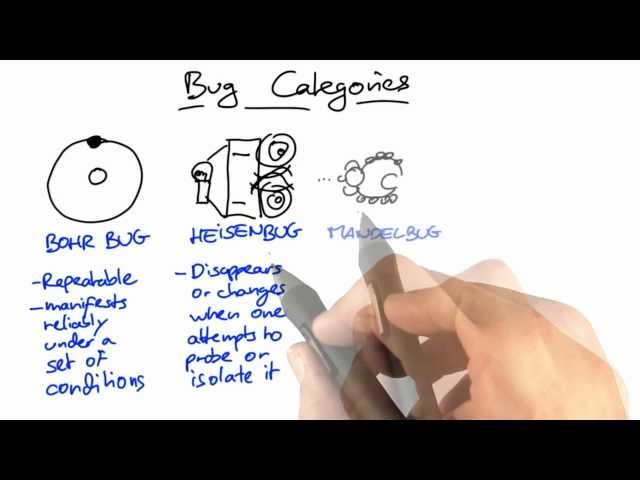
This video is part of an online course, Software Debugging. Check out the course here: https://www.udacity.com/course/cs259.
693 views
11 years ago
You can find the lecture notes and exercises for this lecture at https://missing.csail.mit.edu/2026/debugging-profiling/ 0:00:00 ...
10,751 views
What's next for concurrency testing: debugging tools, distributed systems, and beyond. If you're a Java developer, systems ...
58 views
5 months ago
Final of a series of 4 videos on Process Explorer and other SysInternals tools. Demos of memory leakage, Immersive apps, ...
7,955 views
NOTE: Recitations 1-3 are not available. MIT 6.189 Multicore Programming Primer, IAP 2007 View the complete course: ...
1,769 views
17 years ago


![This Tool Finds Hidden Concurrency Bugs in Java Apps [OOPSLA 2025: Fray]](/api/proxy/image?url=https%3A%2F%2Fi.ytimg.com%2Fvi%2FSDaTOOEDuto%2Fsddefault.jpg)