Upload date
All time
Last hour
Today
This week
This month
This year
Type
All
Video
Channel
Playlist
Movie
Duration
Short (< 4 minutes)
Medium (4-20 minutes)
Long (> 20 minutes)
Sort by
Relevance
Rating
View count
Features
HD
Subtitles/CC
Creative Commons
3D
Live
4K
360°
VR180
HDR
2,382 results
To learn for free on Brilliant, go to https://brilliant.org/techwithtim . Brilliant's also given our viewers 20% off an annual Premium ...
11,158 views
1 month ago
Learn Data Analysis with Python in this comprehensive tutorial for beginners, with exercises included! NOTE: Check description ...
4,042,089 views
5 years ago
In this video course, learn about Python Matplotlib and its concepts. Matplotlib is an open-source plotting library. Create interactive ...
38,129 views
2 years ago
Matplotlib Python Tutorial for Beginners | Data Visualization in Python Matplotlib is a python library used for data ...
11,709 views
3 weeks ago
To try everything Brilliant has to offer—free—for a full 30 days, visit https://brilliant.org/ArtemKirsanov/ The first 200 of you will get ...
902,077 views
MIT 6.100L Introduction to CS and Programming using Python, Fall 2022 Instructor: Ana Bell View the complete course: ...
25,663 views
1 year ago
What if I told you that an AI agent just tried to ruin the career of a developer on Matplotlib who was following Matplotlib policy to not ...
18,686 views
7 days ago
How To Create Subplots using Matplotlib | How To Create Subplots using Python In this Matplotlib subplots tutorial, you'll master ...
46 views
In this video, Dataquest's Director of Curriculum, Anna Strahl, will guide you through how to clean and analyze real survey data ...
1,218 views
7 months ago
A tutorial illustrating how to generate random samples from various distributions, how to plot the samples in a histogram and how ...
1,156 views
4 years ago
IDRE Workshop from April 16, 2021 Materials available here: https://github.com/benjum/idre-spring21-python-data-viz-1.
1,046 views
We have prepared a video tutorial about Matplotlib, which is a plotting library for the Python programming language and ...
661 views
A behind-the-scenes look at how I animate videos. Code for all the videos: https://github.com/3b1b/videos Manim: ...
2,848,779 views
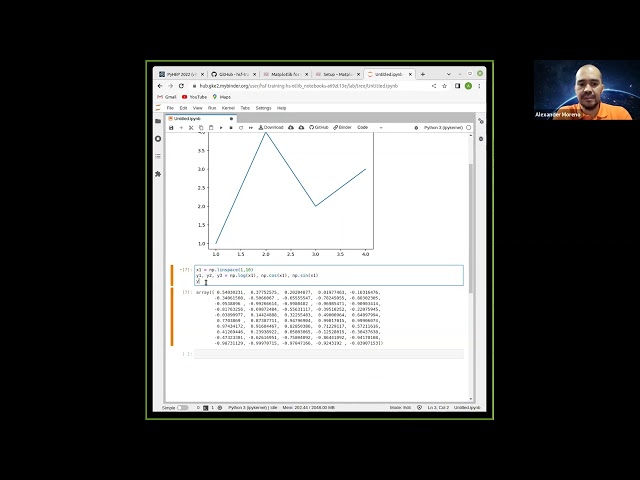
Based on the Matplotlib for HEP workshop developed by HSF Training, we will present a short introduction to matplotlib and ...
61 views
3 years ago
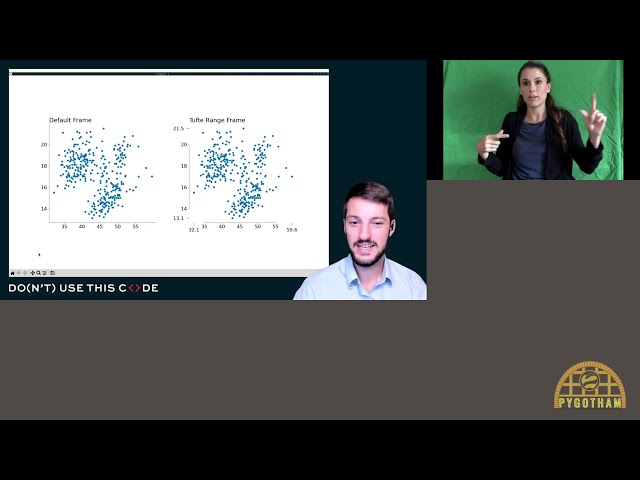
Speaker: Cameron Riddell Edward Tufte is a world renowned professor best known for pioneering the field of data visualization.
32 views
In this video, Learn Data Visualization using Python: What is Matplotlib in Python with an example.
56 views
In this video about exploratory data analysis with pandas and python, Kaggle grandmaster Rob Mulla will teach you the basics of ...
661,831 views
Generating figures is part of the scientific process. This should not be manual, but ideally they should be automatically generated ...
139 views
Visit https://postmarkapp.com/lp/tech-with-tim and use coupon code TECHWITHTIM to get 20% off any plan for three months.
165,008 views
6 months ago
A bar chart race, also known as a bar chart animation or a bar chart race animation, is a data visualization technique that shows ...
6,237 views