Upload date
All time
Last hour
Today
This week
This month
This year
Type
All
Video
Channel
Playlist
Movie
Duration
Short (< 4 minutes)
Medium (4-20 minutes)
Long (> 20 minutes)
Sort by
Relevance
Rating
View count
Features
HD
Subtitles/CC
Creative Commons
3D
Live
4K
360°
VR180
HDR
2,436,677 results
"️ IBM - Data Analyst ...
320,781 views
8 years ago
Links mentioned in this video ⬇️ Exercise File ...
250,294 views
2 years ago
This comprehensive tutorial will teach you everything you need to know about Excel chart types, chart customization, and creating ...
111,154 views
1 year ago
Join my Academy, learn Data & AI skills and land a job https://analyticsautomation.academy/ Mind map available here ...
4,851 views
4 months ago
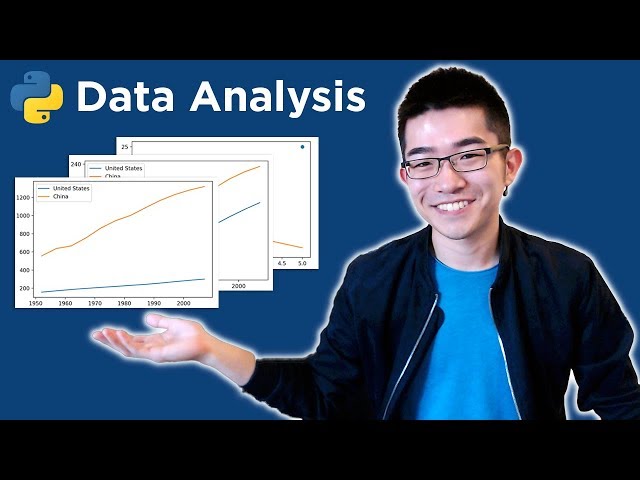
Python data analysis / data science tutorial. Let's go! For more videos like this, I'd recommend my course here: ...
1,532,640 views
7 years ago
Use the code "DATA" to get 25% off The Big Nodebook!!! https://mtranimationgumroad.gumroad.com/l/thebignodebook/DATA Use ...
100,811 views
6 months ago
Learn Excel in just 2 hours: https://kevinstratvert.thinkific.com In this step-by-step tutorial, learn how to pull together charts in Excel.
1,286,834 views
Welcome to the Complete Data Visualization in Python Course! In this full video tutorial, we're diving deep into the world of ...
107,534 views
10 months ago
Learn data visualization with D3.js. D3 is a JavaScript library for manipulating documents based on data. D3 helps you bring data ...
365,066 views
3 years ago
Building blocks of Altair shift the learning to the most fundamental pieces of the Altair data visualization system: - Data types ...
2,502 views
Join my Python Masterclass - https://www.zerotoknowing.com/join-now ***Save 20% off your First Month with code: save20now at ...
17,103 views
This video today is a crash course on Seaborn, a data visualization library for Python built on top of Matplotlib. It makes it super ...
7,933 views
1 month ago
Learn to use Tableau to produce high quality, interactive data visualizations! Tableau can help you see and understand your data.
919,983 views
Learn how to create responsive, animated, interactive charts using Svelte and D3.js from @ever-greg Follow along in your ...
15,869 views
7 months ago
Watch this mini-workshop delivered by best-selling author Cole Nussbaumer Knaflic. Cole demonstrates how to transform graphs ...
334,399 views
Streamed 2 years ago
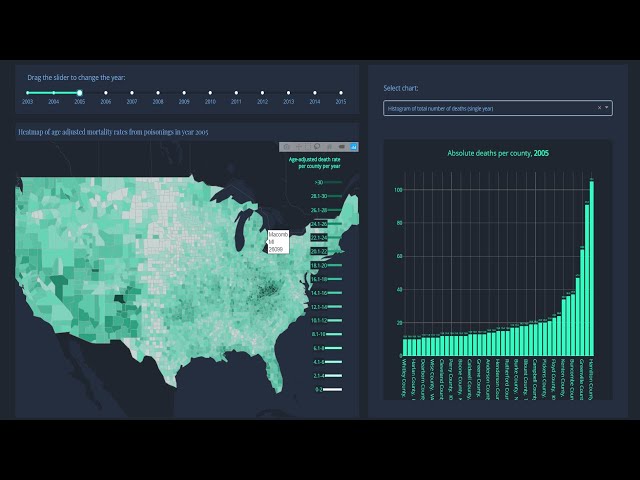
In this video, Dataquest's Director of Curriculum, Anna Strahl, will walk you through how to uncover key traffic patterns on one of ...
1,627 views
8 months ago
An introduction to the Dash web application framework. Dash is used to create browser-based interactive data visualization ...
856,815 views
5 years ago
Practice your Python Pandas data science skills with problems on StrataScratch! https://stratascratch.com/?via=keith Join the ...
277,389 views
6 years ago
Download the free course files and follow along here: ➡️https://www.simonsezit.com/charts-and-dashboards-in-excel-demo-files ...
12,820 views
Take my Full Tableau Course Here: https://www.analystbuilder.com/courses/tableau-for-data-visualization Download Tableau: ...
313,013 views