Upload date
All time
Last hour
Today
This week
This month
This year
Type
All
Video
Channel
Playlist
Movie
Duration
Short (< 4 minutes)
Medium (4-20 minutes)
Long (> 20 minutes)
Sort by
Relevance
Rating
View count
Features
HD
Subtitles/CC
Creative Commons
3D
Live
4K
360°
VR180
HDR
43,171 results
Join my Academy, learn Data & AI skills and land a job https://analyticsautomation.academy/ Mind map available here ...
4,853 views
4 months ago
Use the code "DATA" to get 25% off The Big Nodebook!!! https://mtranimationgumroad.gumroad.com/l/thebignodebook/DATA Use ...
100,821 views
6 months ago
This video today is a crash course on Seaborn, a data visualization library for Python built on top of Matplotlib. It makes it super ...
7,951 views
2 months ago
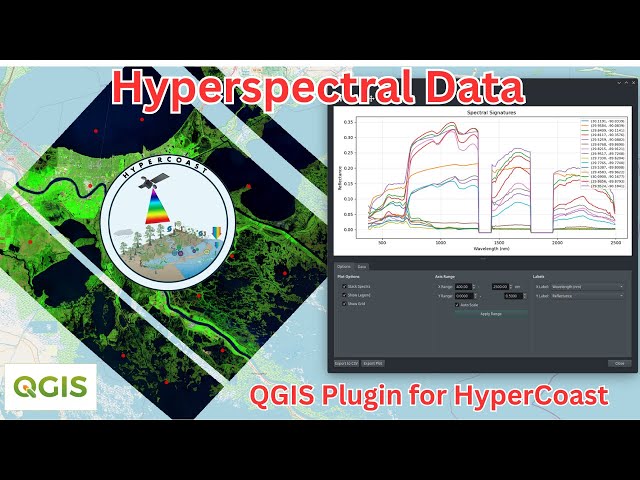
Introducing the HyperCoast QGIS Plugin: Hyperspectral Data Visualization Made Easy In this tutorial, you'll learn how to install ...
1,419 views
3 months ago
Welcome to the Complete Data Visualization in Python Course! In this full video tutorial, we're diving deep into the world of ...
107,733 views
10 months ago
OFF My Dashboards Course (code: SAVE50) https://chandoo.org/wp/excel-school-program/ ~ Become an Excel Dashboard ...
93,532 views
1:1 Mock Interview Application Form: https://forms.gle/koRAx4vcenVsaELB8 Access the Materials from here: ...
5,938 views
8 months ago
Register for Intellipaat's Premium Data Science Course: https://intellipaat.com/data-scientist-course-training/ Access the ...
104,890 views
In this beginner-friendly tutorial, we walk through how to create line charts, scatter plots, and box plots using the powerful ...
1,315 views
This is Vibe Coding 001. Have you ever wanted to build your own software or apps that can just kinda do your work for you inside ...
1,417 views
Streamed 3 months ago
Now, if you're interested at all in data science, AI, machine learning, or data visualization, Pandas is a must learn. And fortunately ...
176,152 views
7 months ago
FREE Course Files & Projects https://lukeb.co/powerbi-files Supporter Access: Problems, Certificate, & More ...
796,054 views
9 months ago
Matplotlib Python Tutorial for Beginners | Data Visualization in Python Matplotlib is a python library used for data ...
15,622 views
1 month ago
LET'S CONNECT ✨ Sign up for my newsletter at https://www.pattvira.com ✨ Instagram: https://www.instagram.com/pattvira ...
1,512 views
... IBM Data Analysis Specialization - https://coursera.pxf.io/AoYOdR Tableau Data Visualization - https://coursera.pxf.io/MXYqaN ...
93,081 views
Qlik Basics: A Beginner's Guide to Data Visualization (Full Course) Ever wondered how to make sense of messy data and turn it ...
206 views
5 months ago
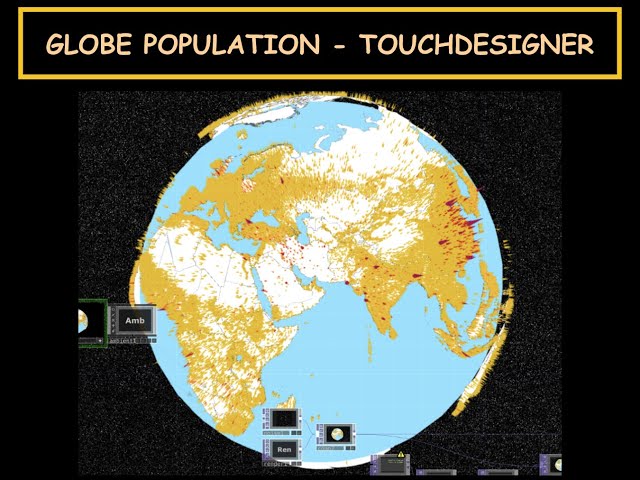
In this tutorial I show how to create 3d world map with countries and cities (base on population size) Resources & Links: Gilab ...
272 views
Master NumPy & Matplotlib in One Video | Full Beginner Tutorial Now here's a powerful YouTube description you can copy: In ...
64 views
12 days ago
I teach the basics of visualizing categorical and continuous variables with the ggplot2 R package, which is part of the tidyverse ...
75 views
In this video, I'll be walking you through everything you need to know in creating visualizations with Pandas. One of the important ...
13 views