ViewTube

ViewTube
Sign inSign upSubscriptions
Filters

Upload date

Type

Duration

Sort by

Features

Reset

421,296 results

freeCodeCamp.org
Excel Data Visualization Course – Guide to Charts & Dashboards

This comprehensive tutorial will teach you everything you need to know about Excel chart types, chart customization, and creating ...

1:10:23
Excel Data Visualization Course – Guide to Charts & Dashboards

107,355 views

1 year ago

Kevin Stratvert
Excel Charts and Graphs Tutorial

Learn Excel in just 2 hours: https://kevinstratvert.thinkific.com In this step-by-step tutorial, learn how to pull together charts in Excel.

24:31
Excel Charts and Graphs Tutorial

1,223,856 views

2 years ago

Simon Sez IT
Interactive Excel Charts and Dashboards - Data Visualization Course

Download the free course files and follow along here: ➡️https://www.simonsezit.com/charts-and-dashboards-in-excel-demo-files ...

2:39:02
Interactive Excel Charts and Dashboards - Data Visualization Course

12,136 views

1 year ago

Learn Skills Daily
Excel Data Analysis Full Course Tutorial (7+ Hours)

Excel Data Analysis Full Course Tutorial (7+ Hours) Get Ad-Free Training by becoming a member today!

7:11:22
Excel Data Analysis Full Course Tutorial (7+ Hours)

1,779,899 views

1 year ago

Teacher's Tech
Turn Raw Data into a Clear, Interactive Dashboard in Excel

Ready to transform your spreadsheets from ordinary to extraordinary? In this tutorial, you'll learn how to take raw, unorganized ...

23:36
Turn Raw Data into a Clear, Interactive Dashboard in Excel

102,797 views

11 months ago

Chandoo
The Ultimate Excel Dashboard: Visualize Data Like a Pro

OFF My Dashboards Course (code: SAVE50) https://chandoo.org/wp/excel-school-program/ ~ Become an Excel Dashboard ...

29:50
The Ultimate Excel Dashboard: Visualize Data Like a Pro

55,708 views

2 months ago

Luke Barousse
Excel for Data Analytics - Full Course for Beginners

FREE Course Files & Projects https://lukeb.co/excel_files Supporter Access: Problems, Certificate, & More ...

10:59:43
Excel for Data Analytics - Full Course for Beginners

2,035,228 views

1 year ago

Simplilearn
DATA VISUALIZATION In EXCEL | How To Build Interactive CHARTS In EXCEL | Simplilearn #excel #charts

"️ IBM - Data Analyst ...

21:06
DATA VISUALIZATION In EXCEL | How To Build Interactive CHARTS In EXCEL | Simplilearn #excel #charts

14,225 views

1 year ago

Learning MsOffice
How to Create a Dashboard in Excel - The Most Detailed Guide

Learn how to create a professional, efficient, and visually appealing dashboard in Excel from scratch! This step-by-step tutorial will ...

1:53:19
How to Create a Dashboard in Excel - The Most Detailed Guide

202,296 views

9 months ago

Other Level’s
Is This Microsoft Excel?! Financial Statistics Dashboards System | Tutorial 1

https://www.other-levels.com The #1 Website Worldwide for Excel Dashboard Templates, Reports, and Professional ...

1:14:30
Is This Microsoft Excel?! Financial Statistics Dashboards System | Tutorial 1

6,375,826 views

3 years ago

Analyst Academy
Data Visualization Crash Course | Consulting Best Practices

Links mentioned in this video ⬇️ Exercise File ...

25:57
Data Visualization Crash Course | Consulting Best Practices

245,785 views

2 years ago

Learn Skills Daily
Excel Visualize Your Data Tutorial

Excel Visualize Your Data Tutorial Get Ad-Free Training by becoming a member today!

50:21
Excel Visualize Your Data Tutorial

13,575 views

9 months ago

Simon Sez IT
Introduction to Data Analysis with Excel: 2-Hour Training Tutorial

Download the free course exercise files to follow along ...

1:53:40
Introduction to Data Analysis with Excel: 2-Hour Training Tutorial

723,964 views

2 years ago

Office Tech Skill
Best 15 Excel Charts for Perfect Data Visualization

excelchart #excelcharts #excelchartstutorial This comprehensive video will teach you everything you need to know about Excel ...

26:38
Best 15 Excel Charts for Perfect Data Visualization

1,499 views

1 year ago

Simon Sez IT
How to Create Data Visualization in Excel using Tables, Slicers and Charts (Includes Free Files)

Download the free course files and follow along here: ...

46:13
How to Create Data Visualization in Excel using Tables, Slicers and Charts (Includes Free Files)

2,640 views

2 months ago

Teacher's Tech
How to Transform Excel Data into a Striking Visual Report with Microsoft Power BI

Welcome to this beginner's tutorial on how to use Microsoft Power BI! In this video, I will guide you through importing data from an ...

30:22
How to Transform Excel Data into a Striking Visual Report with Microsoft Power BI

197,334 views

3 years ago

Alex The Analyst
Full Project in Excel | Excel Tutorials for Beginners

Take my Full Excel for Data Analytics Course! https://www.analystbuilder.com/courses/excel-for-data-analytics In this video we ...

40:50
Full Project in Excel | Excel Tutorials for Beginners

1,169,358 views

3 years ago

Vedakarna
Create a stunning Sales & Profit Dashboard in Excel | Step-by-Step Tutorial.

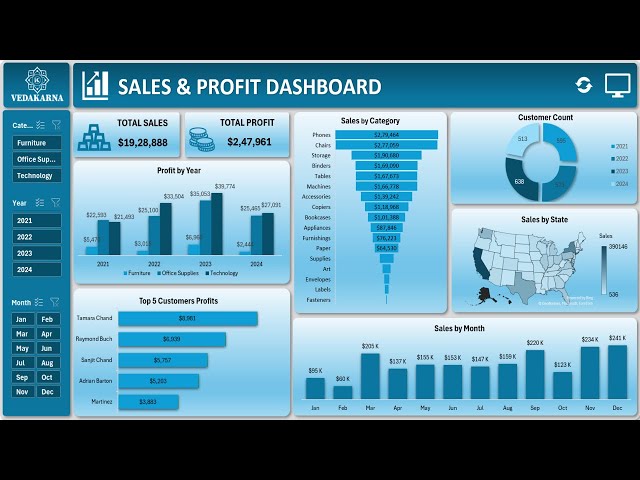
... for more tutorials on Excel with data visualization Let's get started on your journey to mastering dashboards with Vedakarna!

26:10
Create a stunning Sales & Profit Dashboard in Excel | Step-by-Step Tutorial.

265,439 views

1 year ago

Kevin Stratvert
Python in Excel - Beginner Tutorial

Learn Excel in just 2 hours: https://kevinstratvert.thinkific.com In this step-by-step tutorial, learn how you can use Python in ...

20:06
Python in Excel - Beginner Tutorial

516,563 views

2 years ago

META Support
Data Visualization in Excel Made Easy

This beginners-level webinar, originally held on August 21, 2018, is intended for staff in all roles who don't work with data every ...

49:29
Data Visualization in Excel Made Easy

7,105 views

7 years ago