Upload date
All time
Last hour
Today
This week
This month
This year
Type
All
Video
Channel
Playlist
Movie
Duration
Short (< 4 minutes)
Medium (4-20 minutes)
Long (> 20 minutes)
Sort by
Relevance
Rating
View count
Features
HD
Subtitles/CC
Creative Commons
3D
Live
4K
360°
VR180
HDR
2,734,538 results
Links mentioned in this video ⬇️ Exercise File ...
249,403 views
2 years ago
Effective data visualisation comes in many shapes and sizes, but how do you move away from a standard bar chart? Watch the ...
78,817 views
4 years ago
http://www.ted.com David McCandless turns complex data sets (like worldwide military spending, media buzz, Facebook status ...
401,796 views
15 years ago
Data storytelling is one of the most important skills for any data professional. Those who do it effectively can drive serious impact ...
23,094 views
1 year ago
This comprehensive tutorial will teach you everything you need to know about Excel chart types, chart customization, and creating ...
110,226 views
"️ IBM - Data Analyst ...
319,803 views
8 years ago
Learn Data Visualization with D3, JavaScript, and React. Part 2: https://youtu.be/H2qPeJx1RDI Created by @currankelleher .
519,339 views
5 years ago
Join my Academy, learn Data & AI skills and land a job https://analyticsautomation.academy/ Mind map available here ...
4,744 views
4 months ago
Dataviz is easy with R and ggplot. Give me half and hour and I'll show you all the basics and more! If this vid helps you, please ...
63,316 views
Download the free course files and follow along here: ➡️https://www.simonsezit.com/charts-and-dashboards-in-excel-demo-files ...
12,676 views
Learn data visualization with D3.js. D3 is a JavaScript library for manipulating documents based on data. D3 helps you bring data ...
364,738 views
3 years ago
Trustworthy Data Visualization Speaker(s): Kieran Healy Abstract: Visualizations are the most widespread, the most ...
5,041 views
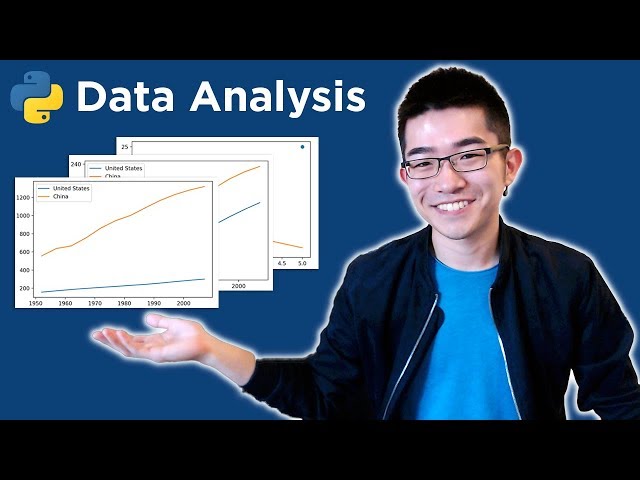
3 months ago
Python data analysis / data science tutorial. Let's go! For more videos like this, I'd recommend my course here: ...
1,532,076 views
7 years ago
Learn to use Tableau to produce high quality, interactive data visualizations! Tableau can help you see and understand your data.
919,312 views
Learn how to visualize and present your data findings as you complete the data analysis process. This video will show you how ...
40,339 views
Course: Advanced Data Visualization: Techniques, Interaction, and Data Patterns Instructor: Data Visualization Developer Robert ...
1,667 views
Streamed 2 years ago
Learn how to use code to visualize your data. Data visualization is one of the most important parts of data analysis. Powerful ...
87,047 views
Join our FREE virtual mini-workshop on June 26th from 11AM-12PM ET!* You'll learn key strategies as bestselling author Cole ...
87,692 views
10 years ago
Learn Data Visualization in R as part of the Coding Boot Camp for the Summer Institutes in Computational Social Science (with ...
3,586 views
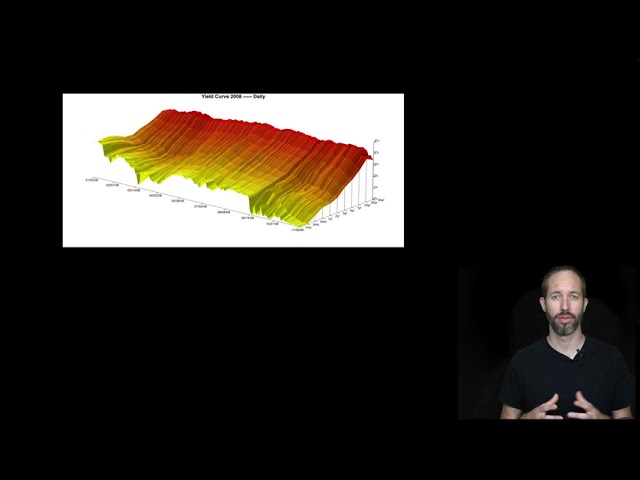
Learn the basics of Python, Numpy, Pandas, Data Visualization, and Exploratory Data Analysis in this course for beginners.
3,194,124 views