Upload date
All time
Last hour
Today
This week
This month
This year
Type
All
Video
Channel
Playlist
Movie
Duration
Short (< 4 minutes)
Medium (4-20 minutes)
Long (> 20 minutes)
Sort by
Relevance
Rating
View count
Features
HD
Subtitles/CC
Creative Commons
3D
Live
4K
360°
VR180
HDR
8,383 results
To learn for free on Brilliant, go to https://brilliant.org/techwithtim . Brilliant's also given our viewers 20% off an annual Premium ...
6,622 views
8 days ago
Register for Intellipaat's Premium Data Science Course: https://intellipaat.com/data-scientist-course-training/ Access the ...
90,474 views
7 months ago
python #coding #matplotlib This video serves as an introduction to the Matplotlib Python library. We'll cover the basics of ...
76,758 views
3 months ago
Welcome to the Complete Data Visualization in Python Course! In this full video tutorial, we're diving deep into the world of ...
89,173 views
8 months ago
If you appreciate the content and the hard work, Please subscribe - https://www.youtube.com/@KeertiPurswani ...
21,334 views
11 months ago
Masters In Data-Analytics with GenAI with Job Guarantee Program - https://codingwise.in/program/data-analytics Python for Data ...
211,094 views
9 months ago
In this beginner-friendly tutorial, we walk through how to create line charts, scatter plots, and box plots using the powerful ...
1,278 views
In this video, I cover the top 2 Python libraries for data visualisation: Matplotlib and Plotly. Matplotlib is the most well-known and ...
831 views
The theory is based on @storytellingwithdata and implemented using matplotlib in python. Code can be found here ...
131 views
In this video, Dataquest's Director of Curriculum, Anna Strahl, will walk you through how to uncover key traffic patterns on one of ...
1,568 views
6 months ago
Final Project! In this video, we combine everything learned — data analysis, visualization, and dashboard building in Python.
1,052 views
This is the only Python data visualisation tutorial you need to learn for a career in Data Science, AI, and Machine Learning in 2025 ...
49,997 views
4 months ago
Mastering Data Visualization for Machine Learning - Matplotlib, Seaborn & Plotly Colab notebook: ...
3,300 views
In this video, Dataquest's Director of Curriculum, Anna Strahl, will guide you through how to clean and analyze real survey data ...
1,189 views
Master Data Visualization with Python in Just 30 Minutes! In this crash course, you'll learn the fundamentals of Matplotlib and ...
176 views
10 months ago
NAISS Training - Matplotlib day 1 Matplotlib is among the most popular and advanced function libraries for the production of ...
50 views
Matplotlib Tutorial in 30 Minutes | Python Data Visualization for Beginners Learn Matplotlib in just 30 minutes This ...
48 views
1 month ago
Bring your scientific data to life with animated visualizations! Learn how to create professional animations in Python using ...
68 views
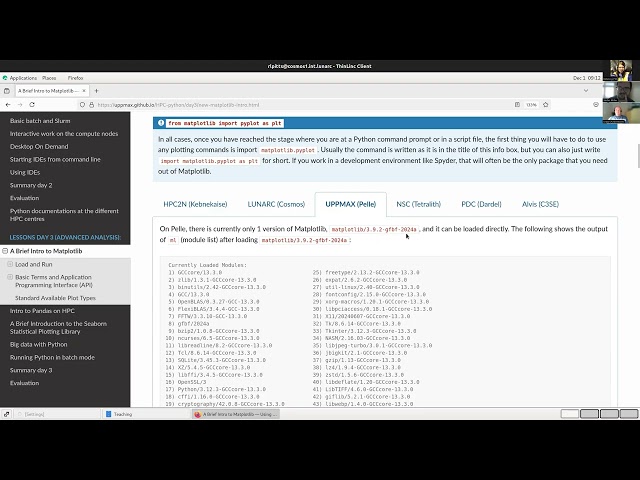
First lecture from day 3 of the "Introduction to Python and Using Python in an HPC environment" course which was given on ...
8 views
Matplotlib Python Tutorial for Beginners | Data Visualization in Python Matplotlib is a python library used for data ...
4,672 views
4 days ago
Applied Plotting, Charting & Data Representation in Python Create impactful data visualizations using Python and ...
190 views
5 months ago
For Online Training Registration: https://goo.gl/r6kJbB ▻ Call: +91-8179191999 Subscribe to our channel and hit the bell ...
2,295 views
Streamed 8 months ago
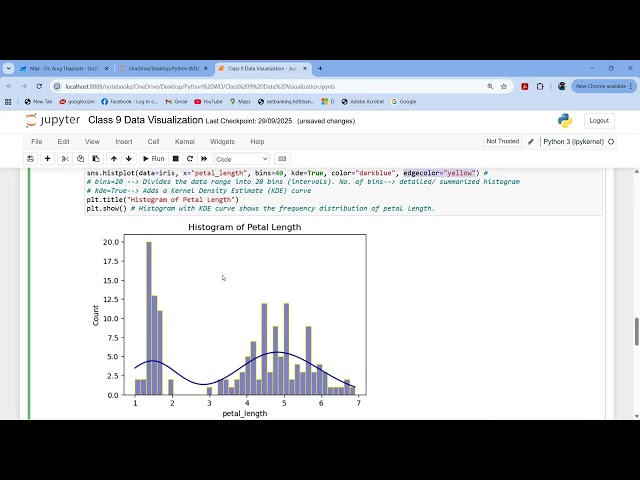
matplotlib #seaborn #plotly #piecharts #scatterplot #barplot #whiskerboxplot #boxplot #histograms #kde #pairplot #violinplot ...
346 views
Welcome to KishoreLytics! This is the **Ultimate Matplotlib Tutorial for 2025** – your complete guide to mastering **data ...
147 views
coding #python #numpy This video serves as an introduction to the NumPy Python library. We'll cover the basics of NumPy so you ...
285,776 views