Upload date
All time
Last hour
Today
This week
This month
This year
Type
All
Video
Channel
Playlist
Movie
Duration
Short (< 4 minutes)
Medium (4-20 minutes)
Long (> 20 minutes)
Sort by
Relevance
Rating
View count
Features
HD
Subtitles/CC
Creative Commons
3D
Live
4K
360°
VR180
HDR
7,075,801 results
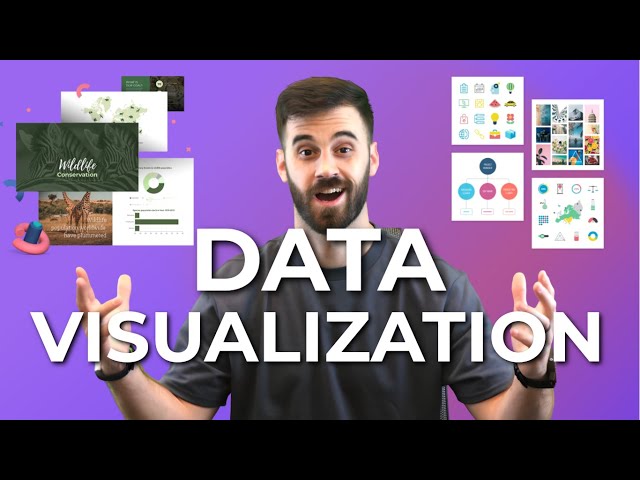
You've probably heard the term data visualization thrown around a lot. It's why you're here, isn't it? So let's make it clear — data ...
180,357 views
3 years ago
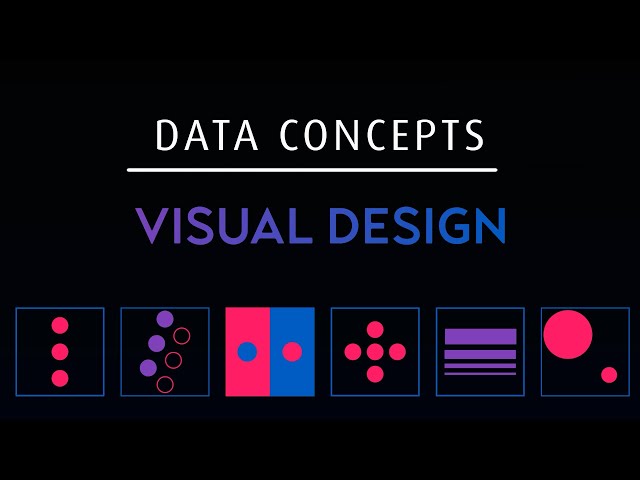
Let's look at how we can implement design concepts and techniques to maximize the impact of our dashboards and reports.
86,405 views
4 years ago
View full lesson: http://ed.ted.com/lessons/david-mccandless-the-beauty-of-data-visualization David McCandless turns complex ...
1,566,840 views
13 years ago
Viewers like you help make PBS (Thank you ) . Support your local PBS Member Station here: http://to.pbs.org/Donateoffbook ...
509,840 views
12 years ago
MENTORSHIP – Applications for the March 2026 cohort are now open! Apply here → https://theanalyticsaccelerator.com/ We're ...
49,181 views
10 months ago
Data visualization is present in every aspect of our lives - but is it really as unbiased as it's said to be? In this SciToons video, learn ...
137,923 views
7 years ago
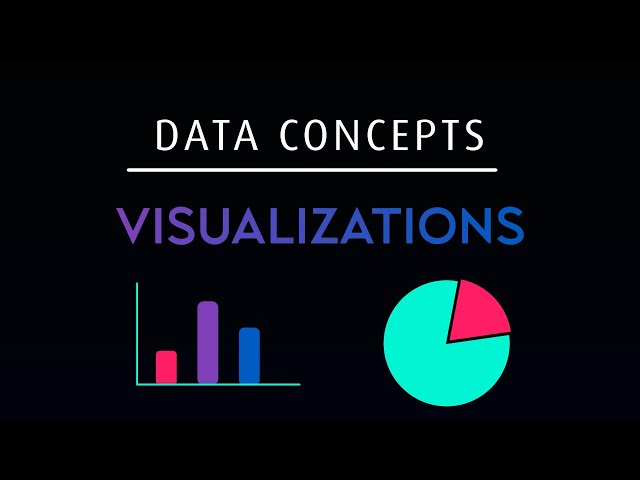
In this video, we will demonstrate the difference between data visualization charts including: - Bar Chart - Line Chart - Bubble ...
188,428 views
6 years ago
In this video, I break down some of the 'science' behind effective data visualization and how you can build better dashboards by ...
383,061 views
2 years ago
Setup, conflict, resolution. You know right away when you see an effective chart or graphic. It hits you with an immediate sense of ...
634,192 views
In this video Rob, a Kaggle Grandmaster, quickly and humorously walks through each of the popular plotting and data ...
109,987 views
Let's look at the art of visualizing data. How do you make eye catching visuals while keeping them easy to consume and ...
13,447 views
Following a look at 'Sensemaking' Associate Professor Dr Kai Xu delves into some more tricks of the visualisation trade.
75,366 views
Dustin hopes that the audience learns how anyone can use data visualization to improve their work, understand their world, and ...
72,691 views
Previously, Data Science built visualizations to answer one question at a time. Explorable data applications can instead reveal ...
29,411 views
In this video we take a look at the best resources to learn Data Visualization in 2025! 25% off Analyst Builder Code: ...
15,834 views
8 months ago
Here are best data visualization tools: 1. Microsoft Power Bi Try Microsoft Power Bi: ...
24,334 views
1 year ago
Data Visualization Monthly Budget Tracker https://shorturl.at/fhlwz.
63,003 views
In this video, I will provide a high-level overview of the Top 5 Python libraries for Data Visualization that you can use to create ...
54,998 views
Try RESPLENDENT DATA for FREE and unlock the full potential of your data: https://resplendentdata.com/mochen Portfolio, ...
6,152 views
A lot of people know how to build charts, but how can you bring that to the NEXT LEVEL? SO WHAT In this video I'll show you ...
2,956 views