Upload date
All time
Last hour
Today
This week
This month
This year
Type
All
Video
Channel
Playlist
Movie
Duration
Short (< 4 minutes)
Medium (4-20 minutes)
Long (> 20 minutes)
Sort by
Relevance
Rating
View count
Features
HD
Subtitles/CC
Creative Commons
3D
Live
4K
360°
VR180
HDR
369 results
Get ready for a shocking combination! In this video, we'll reveal the power of combining Matplotlib and Pandas in Jupyter ...
82 views
1 year ago
This video is about missing data. Missing data is sneaky. In time series settings it is important to impute these values, but you can't ...
838 views
3 years ago
This tutorial delves into the foundational tools (e.g., Matplotlib, Seaborn, Pandas)for data visualization in Python. We'll explore bar ...
600 views
2 years ago
Make basic plots with plot() and ggplot()
955 views
5 years ago
Outro of day 3 - general discussion about the course. 00:00 Q&A and summary of the day: why did we do this? ----- Python for ...
47 views
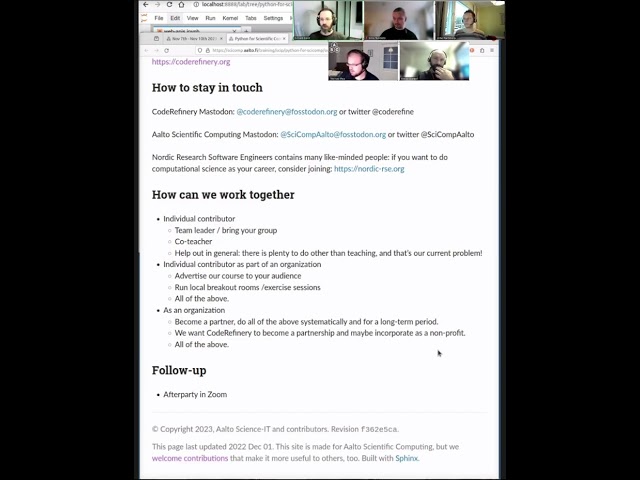
The conclusion of the workshop, looking at feedback, some final discussion. ----- Python for Scientific Computing is a bridge ...
46 views
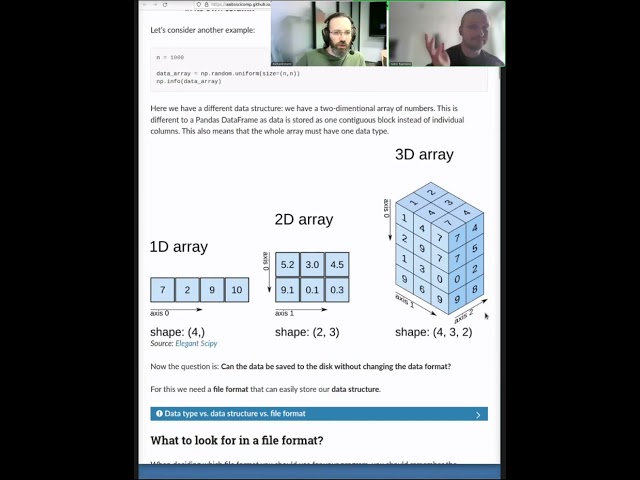
Input/output bandwidth is just as much a consumable resource as CPU or memory. And data formats are important for both ease ...
113 views
Create and Finetune a Chatbot FREE without coding Query AI - https://queryai.co.uk/?ref=lsmhtpxd Join in this comprehensive ...
397 views
Hi everyone, welcome back to our channel. In this video, We're going to show how to view count plot for the data, and profiling the ...
327 views
Saving plots basic savefig png, pdf, ps, eps, svg going to OS and looking at the file.
5,426 views
11 years ago
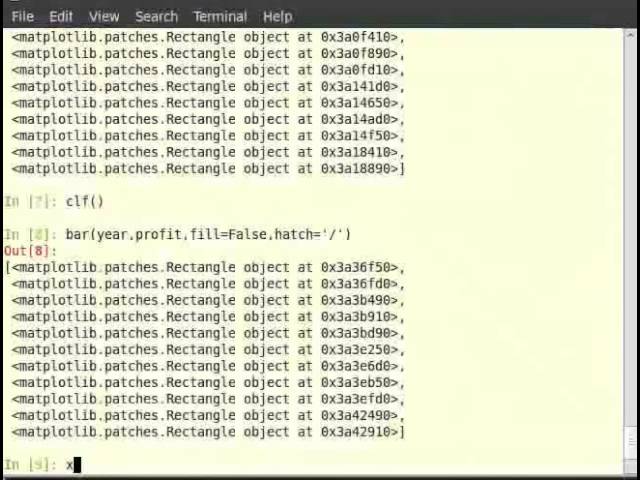
Other types of plots scatter pie chart bar chart log illustration of other plots, matplotlib help.
2,326 views
In this video, I walk through the process of training a machine learning model using Python, specifically focusing on generating a ...
81 views
Abhinav Tushar (he/him) https://emacsconf.org/2023/talks/matplotllm 00:00 Introduction 01:40 What is an LLM? 02:23 Using this ...
233 views
Embellishing a plot Title Label line width, color, style annotations.
6,960 views
Advanced Data Mining with Weka: online course from the University of Waikato Class 3 - Lesson 3: Using R to plot data ...
8,716 views
9 years ago
Video for EME 210 at Penn State. All sectors of the energy industry and related fields continuously use data to inform decisions.
80 views
63 views
In this video, we will explore the structure of pandas DataFrames. I show you how to count unique values in a column and how to ...
640 views
4 years ago
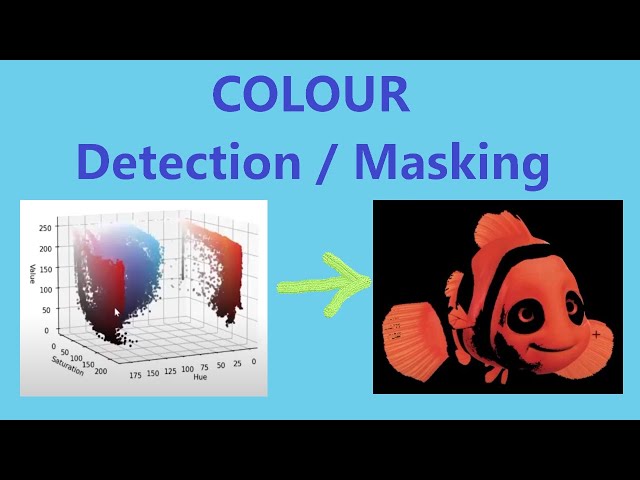
This tutorial uses Python and OpenCV to explain how to choose the custom HSV range for color detection or masking. Interested ...
1,080 views
Video for EME 210: Data Analytics for Energy Systems, at Penn State. For more info, see: ...
49 views
Ever wondered who spends the MOST time on social media? In this video, we analyze a dataset of 62 users to uncover trends in ...
69 views
11 months ago
Plotting the data plot L vs. T2 using square function problem with 3 cols 3rd column is error error bar.
2,327 views
In this detailed walkthrough, I dive into the complexities of developing an interactive knowledge graph using Python, NetworkX, ...
445 views
This video is part of the Mooc “Machine learning in Python with scikit-learn ” hosted on FUN platform: ...
1,529 views
1,227 views
7 years ago