Upload date
All time
Last hour
Today
This week
This month
This year
Type
All
Video
Channel
Playlist
Movie
Duration
Short (< 4 minutes)
Medium (4-20 minutes)
Long (> 20 minutes)
Sort by
Relevance
Rating
View count
Features
HD
Subtitles/CC
Creative Commons
3D
Live
4K
360°
VR180
HDR
33 results
In this video, I covered how to create multi-page AI/BI dashboard in databricks leverating unity catalog data. If you like this video, ...
3,003 views
1 year ago
This video shows how to visualize query in Databricks Notebook. #Databricks #AzureDatabricks #VisualizationTechniques.
1,444 views
What is Databricks? A Detailed Explanation of Databricks and Its Core Concepts Are you curious about Databricks, the powerful ...
311 views
Take my Full Python Course Here: https://www.analystbuilder.com/courses/pandas-for-data-analysis In this series we will be ...
115,310 views
2 years ago
Create professional cloud architecture diagrams automatically using AI, Python, and GitHub Copilot — completely free.
82,874 views
3 months ago
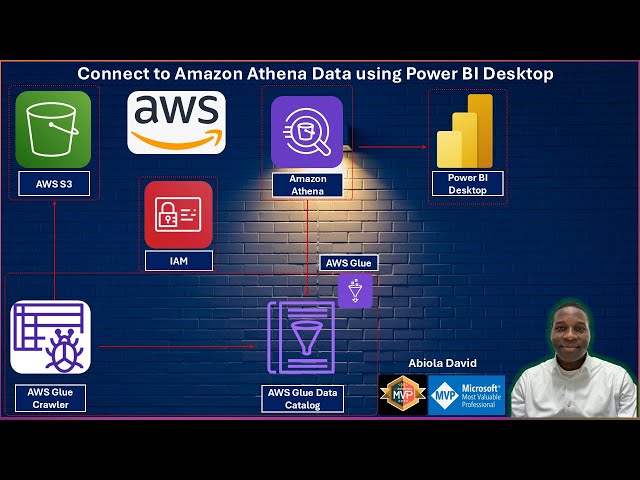
In this new video, I show you how to leverage Power BI Desktop to connect to Amazon Athena Data to build reports. You'll learn ...
1,341 views
Joseph Bradley, Software Engineer, Databricks, talks with George Gilbert at the Databricks Innovation Day in San Francisco, CA.
452 views
9 years ago
01. Jason Scheller, Eyeview, visits theCUBE!. (00:19) 02. Background of Eyeview. (00:57) 03. Indicators of the Spark Impact on ...
561 views
10 years ago
In this video, I show how to use MLflow (https://mlflow.org) with the Transformers library, and why it's a good idea to store the logs ...
9,322 views
3 years ago
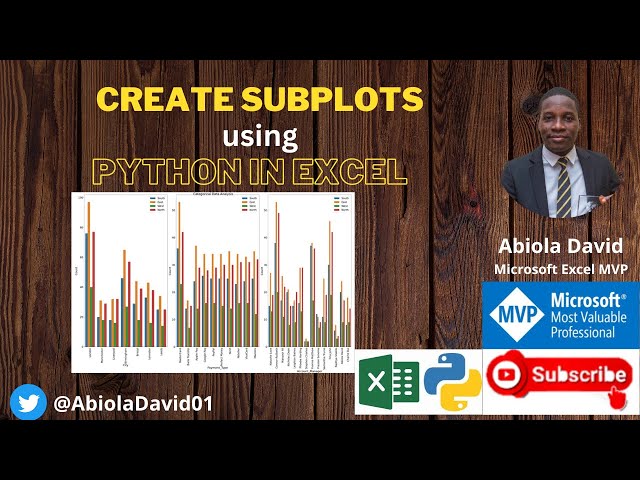
This second video demo how to create subplots using Python in Excel #Excel #PythonInExcel Python Code df = xl("A2:J1041", ...
545 views
In this tableau video, I demo how to connect to dataset in SQL Server and analyze the data in Tableau Desktop #tableau ...
1,199 views
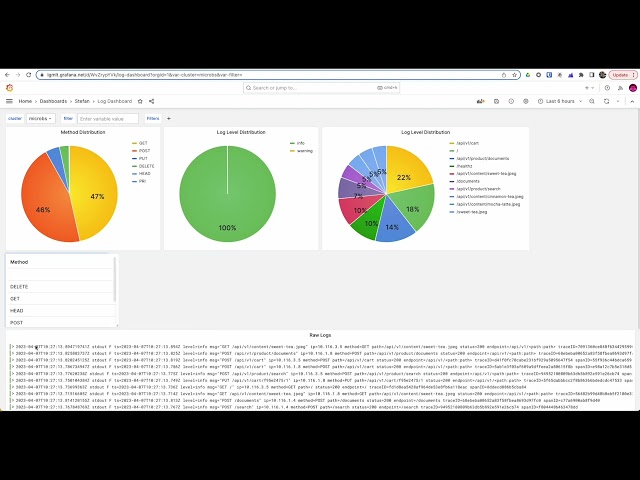
Are you new to Grafana or Grafana Loki or both, then this video is for you. It shows you how to implement a log dashboard in a few ...
49,599 views
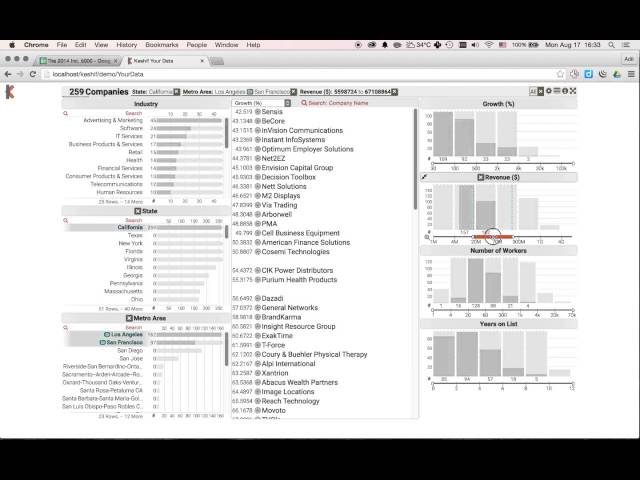
With Keshif, you can explore and understand your data - interactively, visually & easily on the web. What did you like in this video?
6,723 views
8 years ago
Born digital data are increasing in archaeology. RTK GPS and 3D surveying techniques such as laser scanning and ...
29 views
6 years ago
Dans cette vidéo, nous allons parler visualisationde données. Si vous voulez savoir tous les types de graphiques que vous ...
487 views
4 years ago
01. Harriet Fryman, IBM, Visits #theCUBE. (00:21) 02. Reaching the Community of Developers and Data Scientists. (00:51) 03.
331 views
Navigating data transformations efficiently is key, and in my latest video, I break down Snowflake merging in Power Query.
289 views
8 months ago
In this video, I showcased how to easily connect Power BI Desktop to Fabric SQL database and start leveraging data for insightful ...
535 views
9 months ago
Abstract In this research, we demonstrate the application of explainable artificial intelligence (XAI) techniques to investigate ...
100 views
Presented by Wanda Kinasih at Airflow Summit 2023. With millions of orders per day, Gojek needs a data processing solution that ...
1,067 views


![[AMS 2022] Explaining Complex 3D Atmospheric CNNs Using SHAP-Based Channel-wise XAI Techniques](/api/proxy/image?url=https%3A%2F%2Fi.ytimg.com%2Fvi%2F9ICzQJMZy60%2Fsddefault.jpg)