Upload date
All time
Last hour
Today
This week
This month
This year
Type
All
Video
Channel
Playlist
Movie
Duration
Short (< 4 minutes)
Medium (4-20 minutes)
Long (> 20 minutes)
Sort by
Relevance
Rating
View count
Features
HD
Subtitles/CC
Creative Commons
3D
Live
4K
360°
VR180
HDR
112,447 results
Take my Full Power BI Course Here: https://www.analystbuilder.com/courses/microsoft-power-bi-desktop-for-business-intelligence ...
212,130 views
3 years ago
Presented by David Christensen. This video is part of a series of lectures recorded to teach about basic data visualization ...
156 views
4 years ago
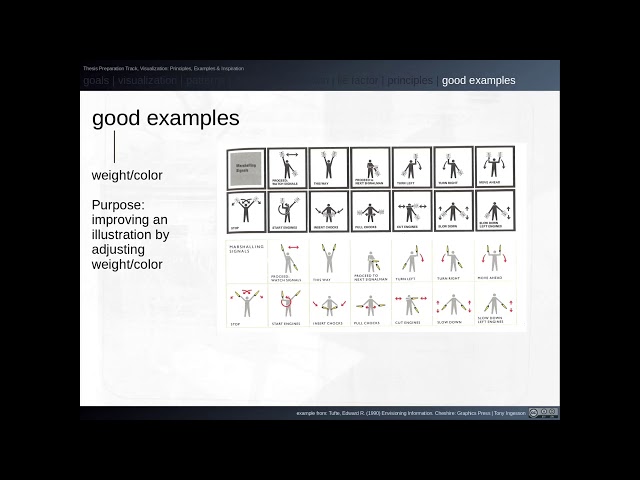
A two-part short lecture on visualization of data: basic visual design principles, bad examples and what Edward Tufte calls "the lie ...
345 views
5 years ago
Introduction to network analysis and visualization with GEPHI. Datasets and tutorial here: ...
109,354 views
Day 1 of NDF 2015, 3.30pm session Tuesday 13 October 2015 Node-link diagrams are overwhelmingly the most common ...
281 views
10 years ago
based on Bertin 1967 Retina (visual ) variables and their Characteristics Edward Tufte 1983 Optimise the Data-Ink ratio Cleveland ...
833 views
7 years ago
This technique unpivots Microsoft Forms data in Power Query to combine responses into a single column in Power BI. This lets us ...
28,502 views
1 year ago
We are sorry for the late upload,there are some connection problem yesterday that make us late to upload, please enjoy This ...
219 views
Mila Dymnikova Let me guess, your code is awesome but no one else gets it? You need a data visualisation! Complex concepts ...
746 views
6 years ago
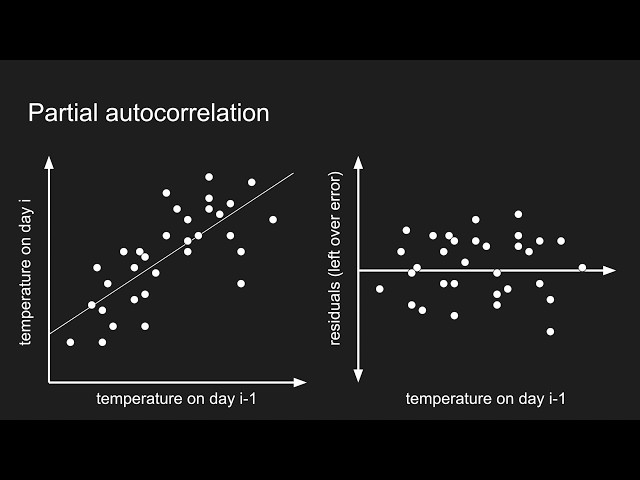
Part of the End-to-End Machine Learning School Course 212, Time-series Analysis at https://e2eml.school/212 To use ...
288,137 views
Database vs Data Warehouse vs Data Lake | Today we take a look at these 3 different ways to store data and the differences ...
1,038,235 views
224 views
We examine input visualizations, visual representations that are designed to collect (and represent) new data rather than encode ...
45 views
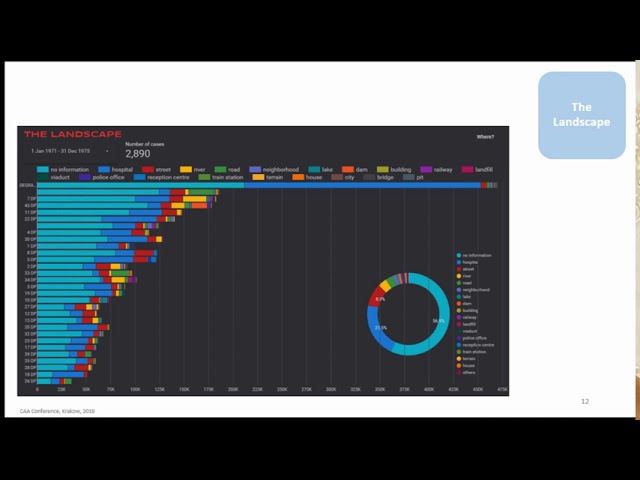
The Brazilian military dictatorship (1964-1985) used disappearance as one of its strategies, leaving hundreds of missing persons ...
30 views
Azure Data Lake (ADL) makes it easy to get started with massive amounts of data. ADL builds on many years of experience that ...
4,793 views
Check out my Full Tableau Course Here: https://www.analystbuilder.com/courses/tableau-for-data-visualization This is our first of ...
974,889 views
A short introduction to the core concepts of data visualization and their application to network biology. The presentation provides a ...
4,547 views
In this tutorial we introduce Input Box's in Excel VBA that give us the ability to source and store information input by the user.
1,255 views
Thomas gives a short presentation about VisualData which is a full-fledged metadata management framework based on ...
46 views
Microsoft just announce Microsoft Fabric which is meant to be a unified data analytics platform. In this video we will dive into some ...
371,127 views
2 years ago