Upload date
All time
Last hour
Today
This week
This month
This year
Type
All
Video
Channel
Playlist
Movie
Duration
Short (< 4 minutes)
Medium (4-20 minutes)
Long (> 20 minutes)
Sort by
Relevance
Rating
View count
Features
HD
Subtitles/CC
Creative Commons
3D
Live
4K
360°
VR180
HDR
1,350 results
Barry shows Jecelyn the new Performance panel landing page featuring a live view of your local Core Web Vitals performance.
14,215 views
1 year ago
Barry joins Jecelyn again to explain how to record a trace in the Performance panel and debug LCP and CLS issues using the ...
31,792 views
Performance debugging just got a whole lot easier. Learn how our new Chrome DevTools Performance panel is more accessible ...
19,266 views
8 months ago
Dive into Interaction to Next Paint (INP), the newest performance metric in the Web Vitals program. Learn from the Chrome team ...
20,982 views
2 years ago
Third party dependencies are often the biggest blockers of achieving Core Web Vitals. Join this session to learn how The ...
876 views
4 years ago
https://lawrence.video/pfsense Forum Post https://forums.lawrencesystems.com/t/why-i-am-not-using-opnsense/21450/1 ...
207,667 views
This video was originally posted at ...
37 views
https://lawrence.video/ In this video, I walk through how to self-host NetAlertX, an open-source network discovery and monitoring ...
149,829 views
Learn how to use the most popular Chrome DevTools features related to inspecting network activity, including: 1:05 - View a ...
399,781 views
6 years ago
Explore how you can meet your business objectives with Core Web Vitals as Vivek from our Web Platforms team talks to Wix, ...
866 views
In this episode of The State of the Web, Rick speaks with Paul Calvano, a Senior Web Performance Architect at Akamai ...
4,295 views
7 years ago
https://lawrence.video/pfsense Are you looking for the best pfSense packages in 2024? Tom dives into the best packages to ...
51,810 views
Explore how well sites across the web are currently doing on the Core Web Vitals metrics and what progress the web has made ...
5,666 views
3 years ago
Interaction to Next Paint (INP) is a Core Web Vital that measures how responsive a page is to interactions. Due to INP's scope, ...
7,793 views
Web Vitals are quality signals key to delivering great UX on the web. This Chrome extension measures the Core Web Vitals, ...
3,431 views
5 years ago
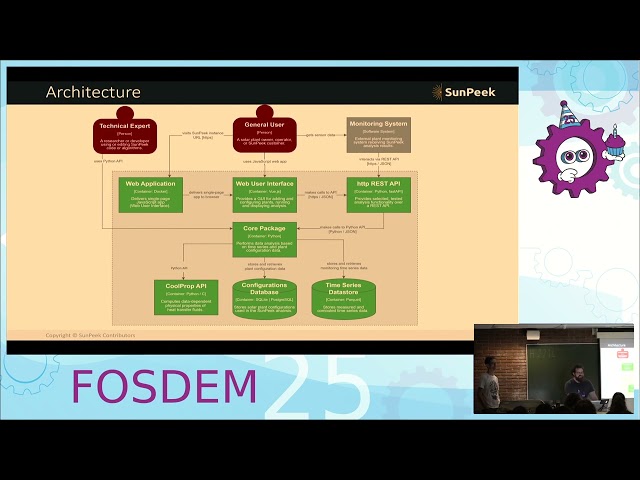
Lightning Talk: Optimize UX and Performance Through Grafana, Prometheus and Lighthouse - Miki Lombardi, Growens At MailUp ...
236 views
Our understanding of how to effectively measure and optimize a user's experience is continually evolving, and we keep our ...
20,947 views
Application Insights is a Preview Service in Microsoft Azure Portal which provides you with Deep Insights & Analytics for your Web ...
9,436 views
10 years ago
Get 40% OFF CodeCrafters: https://app.codecrafters.io/join?via=the-coding-gopher Join my free newsletter on Go & backend ...
311,691 views
New Relic: Web App Performance Monitoring / Paul MacCready - Gossamer Condor by: Bjorn Freeman-Benson.
102 views