Upload date
All time
Last hour
Today
This week
This month
This year
Type
All
Video
Channel
Playlist
Movie
Duration
Short (< 4 minutes)
Medium (4-20 minutes)
Long (> 20 minutes)
Sort by
Relevance
Rating
View count
Features
HD
Subtitles/CC
Creative Commons
3D
Live
4K
360°
VR180
HDR
1,455 results
If you're still using console.log() to find and fix JavaScript issues, you might be spending more time debugging than you need to.
902,409 views
8 years ago
Developers use frameworks, multiple languages, and libraries to build their web applications. Browsers only see the resulting ...
10,680 views
2 years ago
Performance debugging just got a whole lot easier. Learn how our new Chrome DevTools Performance panel is more accessible ...
18,453 views
8 months ago
To watch this keynote interpreted in American Sign Language (ASL), please click here → https://goo.gle/3LYclAp Learn how new ...
30,537 views
3 years ago
We provide a conceptual over of debugging. How to actually debug Java programs using Eclipse will be discussed in later videos ...
4,566 views
9 years ago
This video describes the context menus for debugging that can be triggered by holding Ctrl and right-clicking the WebSquare ...
196 views
4 years ago
Optimizers often push systems to their limits of multidisciplinary analysis, so sometimes solvers don't converge. You can follow a ...
853 views
Interaction to Next Paint (INP) is a Core Web Vital that measures how responsive a page is to interactions. Due to INP's scope, ...
7,735 views
1 year ago
00:00 Introduction 00:08 Goal 00:23 DEMO 05:07 End of DEMO View debugging menus by Ctrl + right-clicking. (1) View logs (2) ...
331 views
It is less about squashing bugs but more about answering the question "what happened" that a nasty product manager or ...
2,897 views
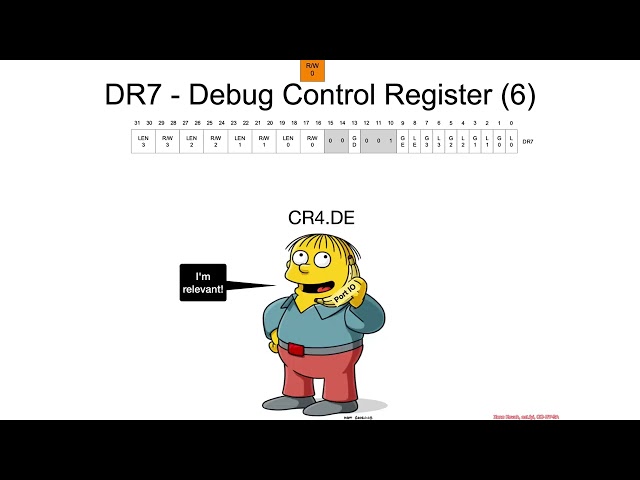
You can watch this class without ads and with quizzes and lab setup instructions by going to https://ost2.fyi/Arch2001.
1,162 views
In this episode, Robert is joined by Mark Downie, who shows us Time Travel Debugging. provides the ability to record a Web app ...
14,551 views
6 years ago
In this episode (part 1 of 2), Robert is joined by Leslie Richardson, who shows several ways you can get the most out of Visual ...
34,186 views
Barry joins Jecelyn again to explain how to record a trace in the Performance panel and debug LCP and CLS issues using the ...
30,300 views
Optimization of complicated multidisciplinary systems is not easy. By following this systematic debugging procedure you can ...
1,649 views
WebAssembly is a new binary format that allows developers to bring their experience and applications from a variety of ...
28,619 views
5 years ago
This is part two of a multi-part series on debugging your optimizations! 0:00 - Intro 0:37 - Check your optimization problem ...
484 views
Diagnosing common JavaScript SEO issues and helpful steps to debug them! Resources: Understand the JavaScript SEO basics ...
13,084 views
Full Playlist: https://youtube.com/playlist?list=PLuj2TAdp0tEpLJqkxLd4breqziSp049pZ&si=_pHNWCxbvqk0v2OR 00:00 - Intro ...
6,395 views
View the full free MOOC at https://ost2.fyi/Dbg3301. This course is an introductory guide to HyperDbg debugger, guiding you ...
396 views
Part of the NERSC New User Training on September 28, 2022. Please see ...
108 views
An quick overview about how to debug WebGL applications.
10,015 views
13 years ago
As you become more proficient with WordPress development, you'll find that sometimes things don't work as expected, and you ...
2,022 views
Tips on debugging CSS Grid with Chrome DevTools. Chapters: 0:00 - Intro 0:20 - Highlight grid with badge 0:40 - Extend grid ...
39,810 views
479 views