Upload date
All time
Last hour
Today
This week
This month
This year
Type
All
Video
Channel
Playlist
Movie
Duration
Short (< 4 minutes)
Medium (4-20 minutes)
Long (> 20 minutes)
Sort by
Relevance
Rating
View count
Features
HD
Subtitles/CC
Creative Commons
3D
Live
4K
360°
VR180
HDR
5,325 results
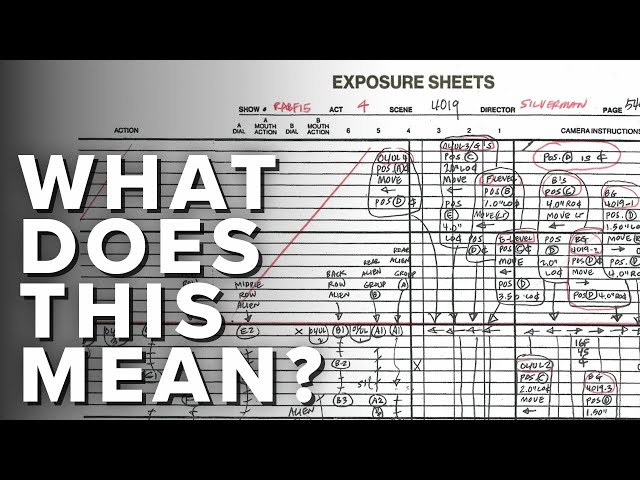
In this lesson John teaches on what an X-Sheet is and how to use one! Learn more Drawing and Animation at Pomeroy Art ...
5,045 views
1 year ago
Blender Tutorial | 3D Chart animation tutorial https://www.youtube.com/watch?v=_9o-ai3VGVk.
655 views
3 years ago
2,040 views
4 years ago
About Data Beast: Data Beast - delivers you daily one or more racing bar graph video you will love. Bar chart animation is the new ...
1,312 views
5 years ago
tww #pregnancy #earlypregnancysymptoms #implantation Nothing feels more nerve-wracking than looking out for pregnancy ...
453,045 views
2 years ago
Review of the causes of the seasons in the northern and southern hemispheres and impacts of Earth's seasons on daily light ...
3,475,675 views
10 years ago
Filmora 15 just made data visuals a whole lot more exciting! In this video, I'll show you how to use the brand-new Animated Charts ...
274 views
2 months ago
You can now achieve amazing character consistency using ChatGPT, I'll show you how to create any custom character and create ...
59,263 views
9 months ago
So many things in a simple way with all codes available here ...
333 views
https://lawrence.video/ https://github.com/lawrencesystems/Draw_IO_Diagrams My previous video on Draw.
75,740 views
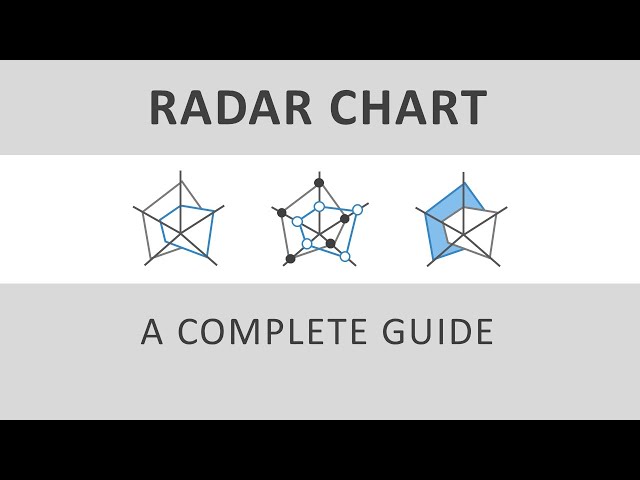
Radar charts are best for quick pattern spotting. Check out how to create them. ✓Complete charting reference: ...
2,466 views
This 2-minute hack could help you get more views on videos you already posted! Want me to help you reach your first 1k ...
1,909,573 views
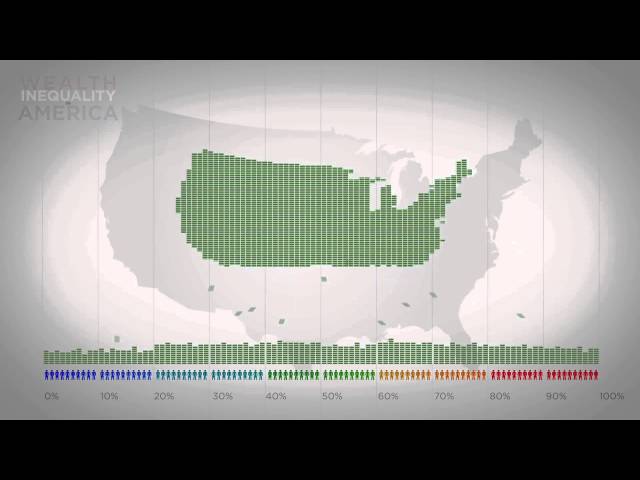
Infographics on the distribution of wealth in America, highlighting both the inequality and the difference between our perception of ...
26,325,732 views
13 years ago
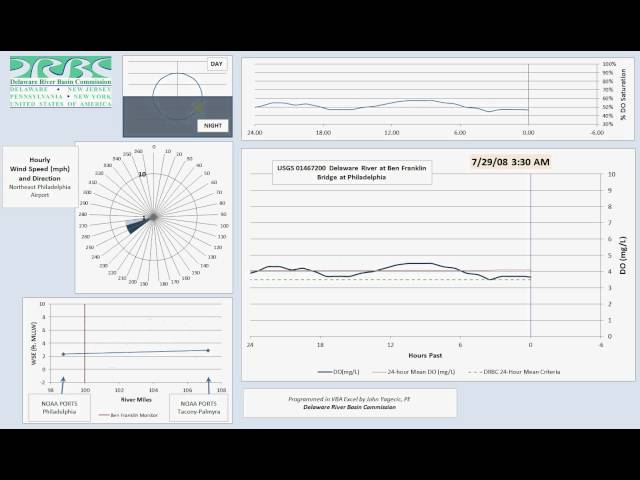
Animated graph of dissolved oxygen (DO) measured in the Delaware River during summer 2008 by the USGS at their monitor at ...
64 views
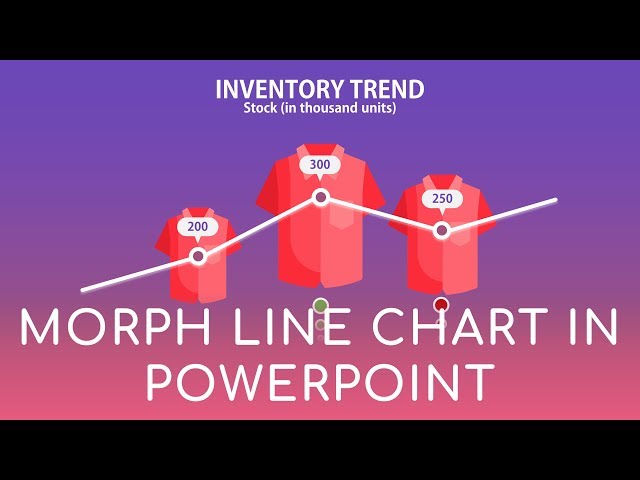
An animated line chart template designed in Microsoft PowerPoint 2016. By using this presentation slide, you can show your own ...
5,185 views
6 years ago
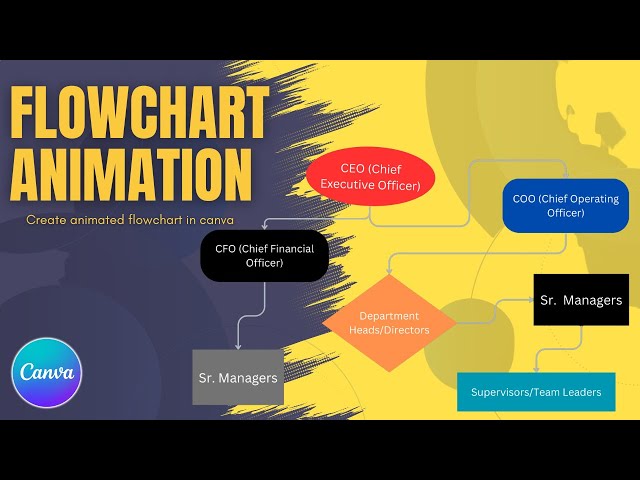
https://www.youtube.com/channel/UCJI8OBaiN0lxktIJoqo22pQ?sub_confirmation=1 How To Create Flowchart Animation in ...
419 views
This video covers the basics of making animated data visualizations in R using either the `animation` or `gganimate` libraries.
88 views
Who will be Most Followed TikTokr in Future ? Wtach this Video Till End About Data Beast: Data Beast - delivers you daily one or ...
316 views
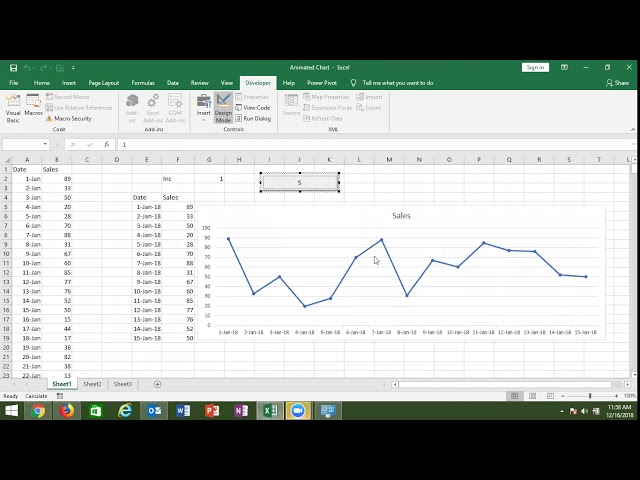
Advanced Excel Training Center For More Details Log on www.iptindia.com and Call - +91 8826828093, +91 8802579388 +91 ...
642 views
7 years ago
This is an animated bar graph of a subreddit. In the graph, each bar on the X axis represents a different post by rank. So the first ...
521 views