Upload date
All time
Last hour
Today
This week
This month
This year
Type
All
Video
Channel
Playlist
Movie
Duration
Short (< 4 minutes)
Medium (4-20 minutes)
Long (> 20 minutes)
Sort by
Relevance
Rating
View count
Features
HD
Subtitles/CC
Creative Commons
3D
Live
4K
360°
VR180
HDR
75,435 results
In this video we take a look at the best resources to learn Data Visualization in 2025! 25% off Analyst Builder Code: ...
15,851 views
9 months ago
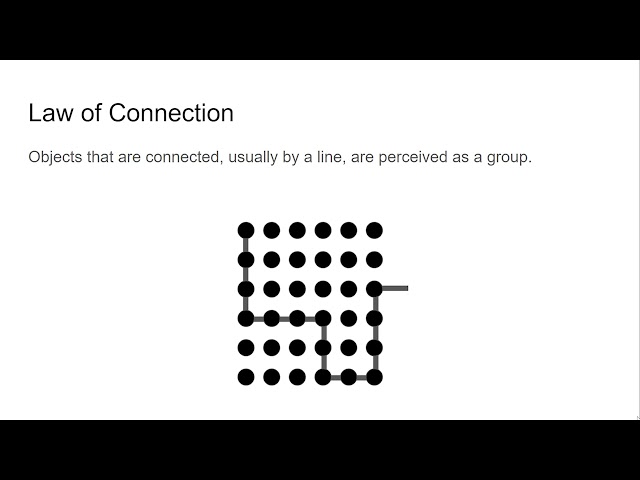
based on Bertin 1967 Retina (visual ) variables and their Characteristics Edward Tufte 1983 Optimise the Data-Ink ratio Cleveland ...
836 views
7 years ago
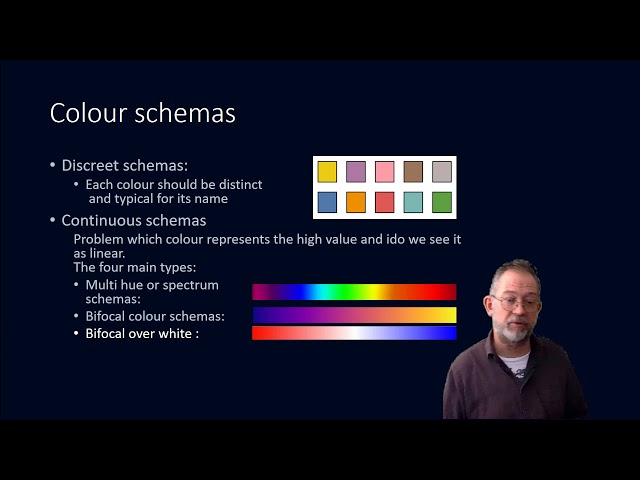
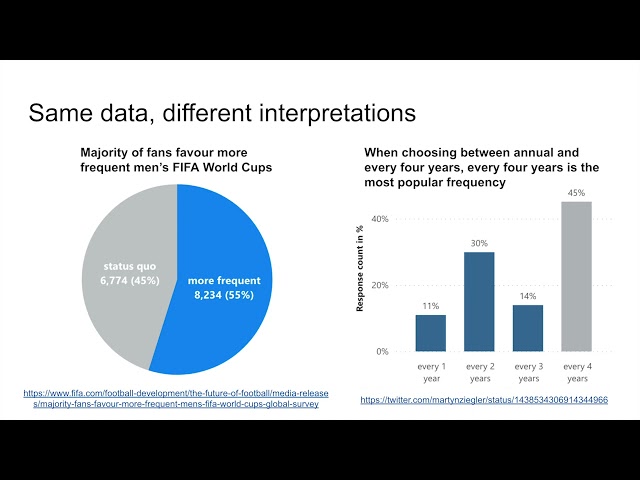
Presented by Alisa Rod. This video is part of a series of lectures recorded to teach about basic data visualization concepts.
315 views
4 years ago
Data Wrangler Spreadsheet Data visualizer GIS Python/R.
363 views
Explore how AI is revolutionizing data visualization and statistics, making complex data easier to understand and analyze.
56 views
1 year ago
Presented by David Christensen. This video is part of a series of lectures recorded to teach about basic data visualization ...
314 views
... IBM Data Analysis Specialization - https://coursera.pxf.io/AoYOdR Tableau Data Visualization - https://coursera.pxf.io/MXYqaN ...
1,055,759 views
3 years ago
Presented by Angela Zoss. This video is part of a series of lectures recorded to teach about basic data visualization concepts.
102 views
... Data Analysis Specialization - https://coursera.pxf.io/AoYOdR Tableau Data Visualization - https://coursera.pxf.io/MXYqaN ...
216,186 views
A short introduction to the core concepts of data visualization and their application to network biology. The presentation provides a ...
4,585 views
167 views
Presented by Tess Grynoch. This video is part of a series of lectures recorded to teach about basic data visualization concepts.
101 views
116,158 views
2 years ago
Check out my Full Tableau Course Here: https://www.analystbuilder.com/courses/tableau-for-data-visualization This is our first of ...
982,322 views
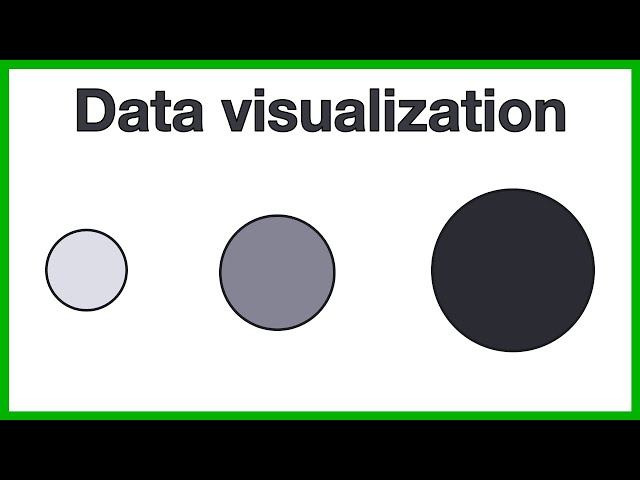
Why does data visualization matter? Simply put, data visualization, or data vis, does three things for us: it enables us to better ...
435 views
6 years ago
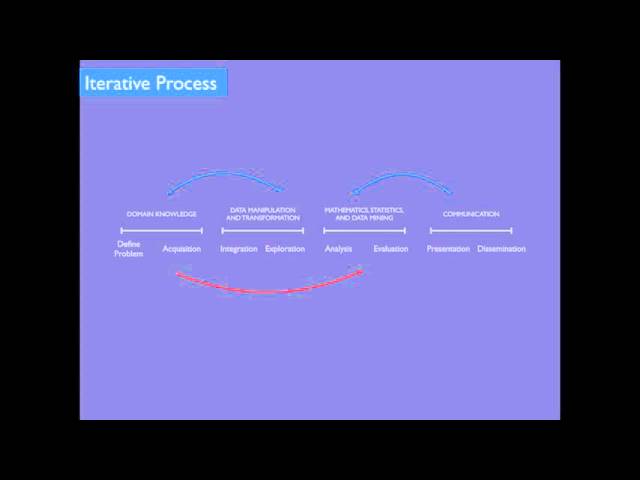
Recordings from the University of San Francisco's Spring 2016 MSAN 622 course: Introduction to Data and Information ...
361 views
9 years ago
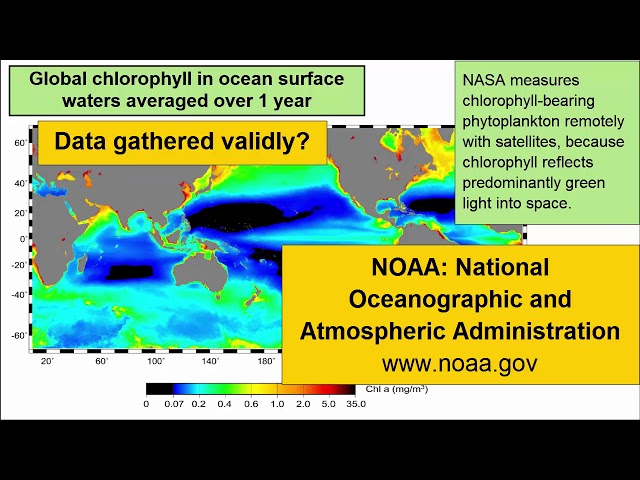
For an introductory college-level earth sciences class: a review of how to read and critically evaluate data visualizations such as ...
8,991 views
8 years ago
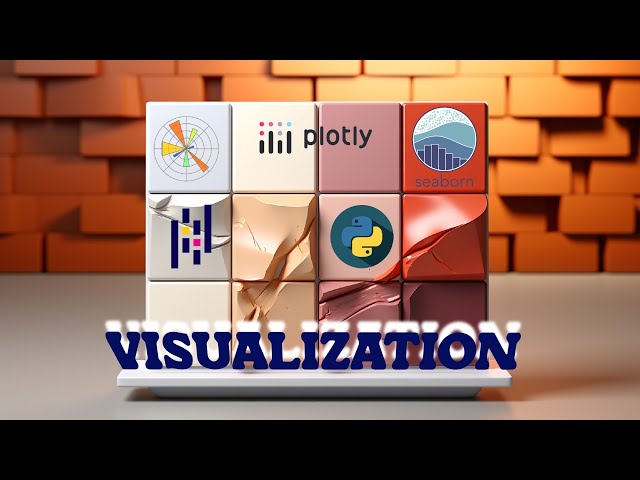
In this video, we dive deep into the world of data visualization in Python using three powerful libraries: Matplotlib, Seaborn, and ...
157 views
This tutorial delves into the foundational tools (e.g., Matplotlib, Seaborn, Pandas)for data visualization in Python. We'll explore bar ...
600 views
28 views