Upload date
All time
Last hour
Today
This week
This month
This year
Type
All
Video
Channel
Playlist
Movie
Duration
Short (< 4 minutes)
Medium (4-20 minutes)
Long (> 20 minutes)
Sort by
Relevance
Rating
View count
Features
HD
Subtitles/CC
Creative Commons
3D
Live
4K
360°
VR180
HDR
2,666 results
In this episode (part 1 of 2), Robert is joined by Leslie Richardson, who shows several ways you can get the most out of Visual ...
34,474 views
6 years ago
https://devtoolsforbeginners.kevinpowell.co/ ✓ https://polypane.app/?ref=kevin (this is an affiliate link, so if you do purchase after ...
22,058 views
8 months ago
Edebug, instrumenting and stepping and breakpoints. Also macroexpand and how it helps with debugging.
9,428 views
11 years ago
If you're still using console.log() to find and fix JavaScript issues, you might be spending more time debugging than you need to.
908,698 views
8 years ago
Barry joins Jecelyn again to talk about the Fetch Priority API and how it can be used to improve LCP image load times. Learn how ...
13,716 views
2 years ago
Performance debugging just got a whole lot easier. Learn how our new Chrome DevTools Performance panel is more accessible ...
21,002 views
10 months ago
What is HTML? What is the DOM tree? Let's demystify them and learn how to debug them with DevTools. Chapters: 0:00 Intro 0:15 ...
81,136 views
Join Jecelyn in this episode of DevTools Tips and discover how source maps can improve your debugging workflow. Learn why ...
32,674 views
3 years ago
Barry joins Jecelyn again to explain how to record a trace in the Performance panel and debug LCP and CLS issues using the ...
35,014 views
1 year ago
Chrome DevTools now has a Model Context Protocol (MCP) server that lets AI agents interact directly with your browser.
8,905 views
2 months ago
Jecelyn teams up with Barry again to talk about the new Speculation Rules API which can be used to prefetch and prerender ...
10,168 views
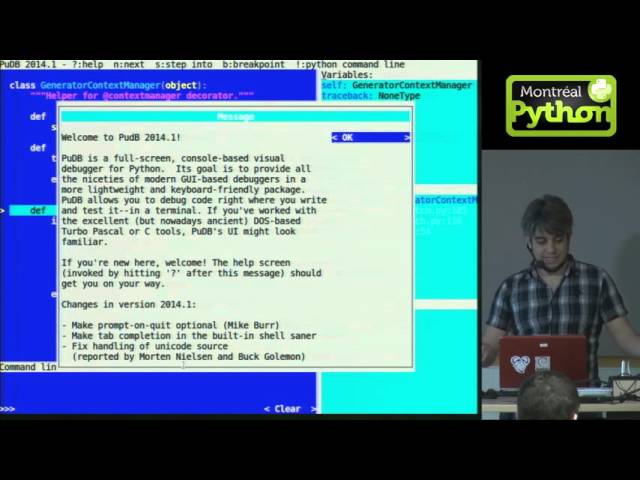
Montreal, QC, September 14, 2015 - Jordi Gutiérrez Hermoso presents PuDB, a full-screen, console-based visual debugger for ...
7,992 views
10 years ago
Trying to inspect an element, and “poof” it's gone? It's like your code is playing hide-and-seek with you! Don't worry, learn these 6 ...
35,893 views
Optimization of complicated multidisciplinary systems is not easy. By following this systematic debugging procedure you can ...
1,754 views
In this episode (part 2 of 2), Robert is joined by Leslie Richardson, who shows several ways you can get the most out of Visual ...
13,484 views
PWA stands for Progressive Web Apps. In this episode, Adriana and Jecelyn will walk us through some tips to build and debug a ...
14,778 views
Learn how to optimize your site for the bfcache, and discover powerful debugging techniques to troubleshoot any blocking issues.
24,063 views
Learn how to debug your web app effectively with Chrome DevTools. Inspect and modify components, create watch expressions ...
42,000 views
5 years ago
Extensions are built on web technologies like HTML, CSS and JavaScript and let you extend Chrome to make it your own. In this ...
42,475 views
You can use the Animations tab in DevTools to inspect, scrub and modify animations. Learn now on today's episode of DevTools ...
37,327 views