ViewTube

ViewTube
Sign inSign upSubscriptions
Filters

Upload date

Type

Duration

Sort by

Features

Reset

1,527 results

Alex The Analyst
FREE Data Analyst Bootcamp!!

... Data Visualization - https://coursera.pxf.io/MXYqaN Udemy Courses: Python for Data Science - https://bit.ly/3Z4A5K6 ...

6:52
FREE Data Analyst Bootcamp!!

2,483,132 views

2 years ago

fuzzyprogrammer
Master JavaScript Algorithms & Data Structures (FreeCodeCamp Curriculum) | Arrays

Welcome to the ultimate guide to mastering JavaScript Algorithms and Data Structures! In this comprehensive playlist, we follow ...

6:14
Master JavaScript Algorithms & Data Structures (FreeCodeCamp Curriculum) | Arrays

46 views

9 months ago

fuzzyprogrammer
Master JavaScript Algorithms & Data Structures (FreeCodeCamp Curriculum) | Methods

Welcome to the ultimate guide to mastering JavaScript Algorithms and Data Structures! In this comprehensive playlist, we follow ...

5:57
Master JavaScript Algorithms & Data Structures (FreeCodeCamp Curriculum) | Methods

35 views

9 months ago

fuzzyprogrammer
Master JavaScript Algorithms & Data Structures (FreeCodeCamp Curriculum) | Variables part 1

Welcome to the ultimate guide to mastering JavaScript Algorithms and Data Structures! In this comprehensive playlist, we follow ...

11:43
Master JavaScript Algorithms & Data Structures (FreeCodeCamp Curriculum) | Variables part 1

61 views

9 months ago

fuzzyprogrammer
Master JavaScript Algorithms & Data Structures (FreeCodeCamp Curriculum) | Loops & String

Welcome to the ultimate guide to mastering JavaScript Algorithms and Data Structures! In this comprehensive playlist, we follow ...

9:21
Master JavaScript Algorithms & Data Structures (FreeCodeCamp Curriculum) | Loops & String

21 views

9 months ago

Alex The Analyst
Best Course to Learn Statistics for Data Analysis

... Python for Data Analysis and Visualization- https://bit.ly/3hhX4LX Statistics for Data Science - https://bit.ly/37jqDbq SQL for Data ...

6:12
Best Course to Learn Statistics for Data Analysis

133,915 views

4 years ago

Ganesh H
3 - Work with Data - Data Visualization with D3 - freeCodeCamp Tutorial

We look at the data and enter methods to associate a set of HTML elements with a set of data, and create and modify elements.

4:32
3 - Work with Data - Data Visualization with D3 - freeCodeCamp Tutorial

643 views

5 years ago

Alex The Analyst
Google vs IBM Data Analytics Certificates | Which is Better?

... Python for Data Analysis and Visualization- https://bit.ly/3hhX4LX Statistics for Data Science - https://bit.ly/37jqDbq SQL for Data ...

5:58
Google vs IBM Data Analytics Certificates | Which is Better?

391,125 views

4 years ago

Ganesh H
27 - Use Dynamic Scales - Data Visualization with D3 - freeCodeCamp Tutorial

At 10:10, I meant to say set the HIGHEST value. We'll create two linear scales to dynamically scale the circles in a scatter plot.

10:37
27 - Use Dynamic Scales - Data Visualization with D3 - freeCodeCamp Tutorial

906 views

5 years ago

Ganesh H
10 - Learn About SVG in D3 - Data Visualization with D3 - freeCodeCamp Tutorial

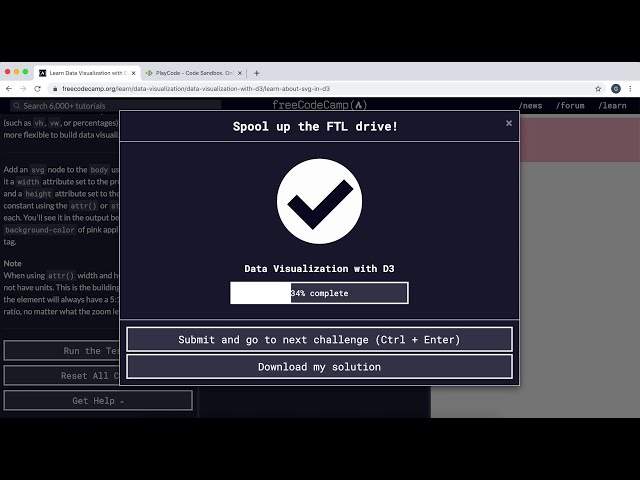
We can use D3 to create SVG shapes on our page, to create visualizations of our data. Link to challenge ...

4:39
10 - Learn About SVG in D3 - Data Visualization with D3 - freeCodeCamp Tutorial

564 views

5 years ago

create value
lets play Free Code Camp:  Intermediate Algorithm Scripting: Wherefore art thou

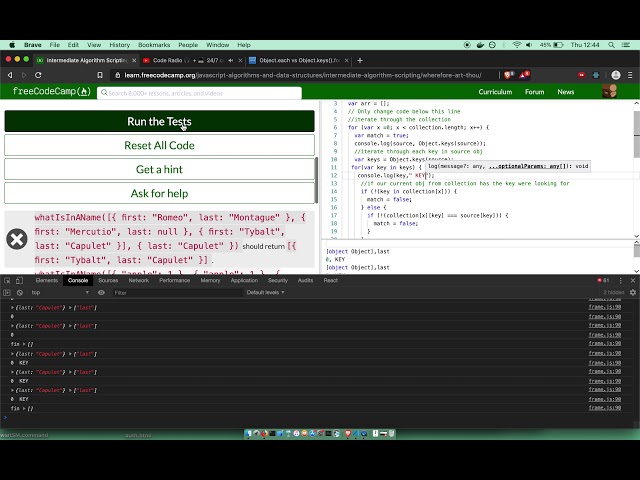
Watch as we solve the free code camp intermediate algorithm scripting challenge Wherefore art thou. WARNING ***SPOILERS*** ...

14:26
lets play Free Code Camp: Intermediate Algorithm Scripting: Wherefore art thou

53 views

6 years ago

Alex The Analyst
Database vs Data Warehouse vs Data Lake | What is the Difference?

... Python for Data Analysis and Visualization- https://bit.ly/3hhX4LX Statistics for Data Science - https://bit.ly/37jqDbq SQL for Data ...

5:22
Database vs Data Warehouse vs Data Lake | What is the Difference?

1,032,684 views

3 years ago

King's Geocomputation
Code Camp1: Introduction (Notebook 1 and 2)

An introduction to code camp by King's Spatial Data Science Pathway available here ...

7:13
Code Camp1: Introduction (Notebook 1 and 2)

862 views

5 years ago

Ganesh H
24 - Create a Linear Scale with D3 - Data Visualization with D3 - freeCodeCamp Tutorial

Linear Scales allow us to scale our SVG elements. This maintains the proportions of the graph and re-scales it when the ...

4:24
24 - Create a Linear Scale with D3 - Data Visualization with D3 - freeCodeCamp Tutorial

674 views

5 years ago

Ganesh H
26 - Use d3.max, d3.min to find Min, Max Values - Data Visualization with D3 - freeCodeCamp Tutorial

The D3 Min and D3 Max methods can be used to find the minimum and maximum values from a dataset. We can use a callback ...

4:32
26 - Use d3.max, d3.min to find Min, Max Values - Data Visualization with D3 - freeCodeCamp Tutorial

728 views

5 years ago

create value
Let's play Free Code Camp Intermediate Algorithm Scripting: Smallest Common Multiple

we solve the Free Code Camp Intermediate Algorithm Scripting: Smallest Common Multiple. You can complete this yourself at ...

7:31
Let's play Free Code Camp Intermediate Algorithm Scripting: Smallest Common Multiple

249 views

6 years ago

Ganesh H
29 - Add Axes to a Visualization - Data Visualization with D3 - freeCodeCamp Tutorial

We can use some D3 methods to create axes from a set of data and a scale. This returns a set of SVG shapes, on which we can ...

10:50
29 - Add Axes to a Visualization - Data Visualization with D3 - freeCodeCamp Tutorial

735 views

5 years ago

Ganesh H
File Metadata Microservice - freeCodeCamp APIs and Microservices Project Tutorial

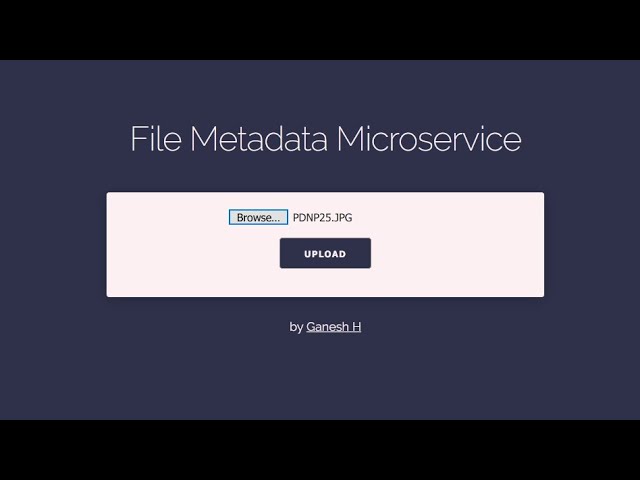
This is a full walkthrough for the File Metadata Microservice project on freeCodeCamp. We can install an npm package called ...

9:53
File Metadata Microservice - freeCodeCamp APIs and Microservices Project Tutorial

2,806 views

5 years ago

Ganesh H
23 - Add Labels to Scatter Plot Circles - Data Visualization with D3 - freeCodeCamp Tutorial

Labels can be added to the SVG circles, with text elements. We can set the x and y coordinates as well as the inner text using ...

4:18
23 - Add Labels to Scatter Plot Circles - Data Visualization with D3 - freeCodeCamp Tutorial

1,574 views

5 years ago

Ganesh H
17 - Add Labels to D3 Elements - Data Visualization with D3 - freeCodeCamp Tutorial

Let's add some labels to our bars. We can use the SVG text element to render text on an SVG canvas. We can give this x and y ...

5:04
17 - Add Labels to D3 Elements - Data Visualization with D3 - freeCodeCamp Tutorial

1,420 views

5 years ago