Upload date
All time
Last hour
Today
This week
This month
This year
Type
All
Video
Channel
Playlist
Movie
Duration
Short (< 4 minutes)
Medium (4-20 minutes)
Long (> 20 minutes)
Sort by
Relevance
Rating
View count
Features
HD
Subtitles/CC
Creative Commons
3D
Live
4K
360°
VR180
HDR
187,169 results
Example code: https://rebrand.ly/kg1qk17 Chapters 00:00 - Intro to Matplotlib 00:29 - Install Matplotlib 00:35 - Import pyplot ...
8,839 views
1 year ago
python #coding #matplotlib Matplotlib is a Python library used for data visualization. It provides a MATLAB-like interface for quick ...
24,229 views
4 months ago
Complete SciPy 2015 Talk & Tutorial Playlist here: http://ow.ly/PHjEN.
174,245 views
10 years ago
In this video we learn how to visualize 3D plots in Matplotlib. ◾◾◾◾◾◾◾◾◾◾◾◾◾◾◾◾◾ Programming Books ...
145,077 views
4 years ago
Our favourite plotting library may just be matplotlib again now that we made it interactive with a puck! It may sounds strange at first, ...
6,321 views
7 days ago
In this video, we will be learning how to create histograms in Matplotlib. This video is sponsored by Brilliant.
208,129 views
6 years ago
Learn to plot graphs in Python in this tutorial! We cover matplotlib and show you how to get an awesome looking plot. As part of ...
56,219 views
5 years ago
Learn matplotlib in this data science programming tutorial. Learn how to plot line graphs and histograms in Python using the ...
191,246 views
Today we learn a fundamental data science skill. We learn how to animate plots using Matplotlib in Python.
197,742 views
Visualization is central to the process of how we think. This video reviews the inner workings of Python's most popular plotting ...
3,806 views
Master AI from Zero to Advanced: https://ailearninghub.io ------------------------- In this video, you'll learn the fundamentals of creating ...
817 views
10 months ago
Today we learn how to make our Matplotlib visualizations interactive by using widgets.
23,601 views
2 years ago
Master Matplotlib for your next data science interview! This comprehensive tutorial covers everything you need to know about ...
163 views
Today's matplotlib tutorial is all about the package's object-oriented interface, which uses figures and axes to specify plotting ...
1,169 views
In this video tutorial, you will learn how to make multiple line graph in Python using Matplotlib. You will learn how to filter and ...
1,933 views
python #coding #matplotlib In this video I will show you how to create subplots using Matplotlib.
7,809 views
3 months ago
notebook used in this tutorial: https://github.com/codebasics/py/blob/master/matpltlib/1_intro/1_matplotlib_introduction.ipynb ...
187,591 views
8 years ago
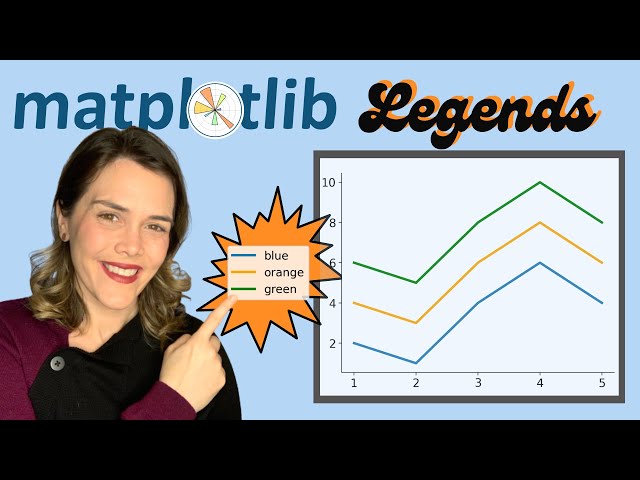
This matplotlib legend tutorial walks you through basic and advanced options for matplotlib legends using Python code for a ...
22,390 views
Matplotlib boxplots can be used for a variety of tasks which include: outlier detection, understanding the data range and ...
30,379 views
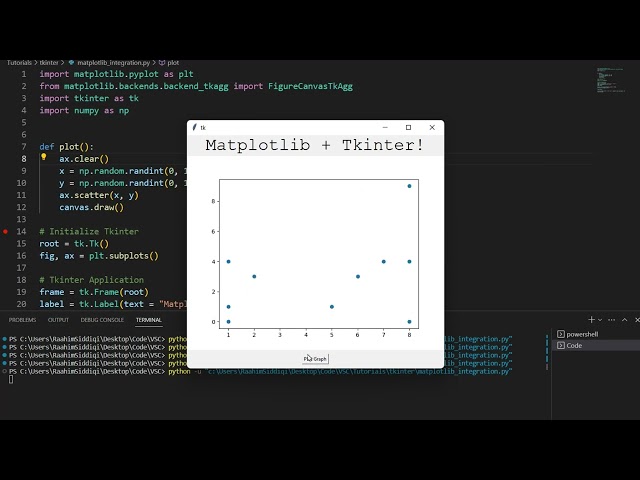
Learn how to combine the Plotting Power of Matplotlib with the the UX/UI of Tkinter! ### Website Link ...
41,252 views