Upload date
All time
Last hour
Today
This week
This month
This year
Type
All
Video
Channel
Playlist
Movie
Duration
Short (< 4 minutes)
Medium (4-20 minutes)
Long (> 20 minutes)
Sort by
Relevance
Rating
View count
Features
HD
Subtitles/CC
Creative Commons
3D
Live
4K
360°
VR180
HDR
175 results
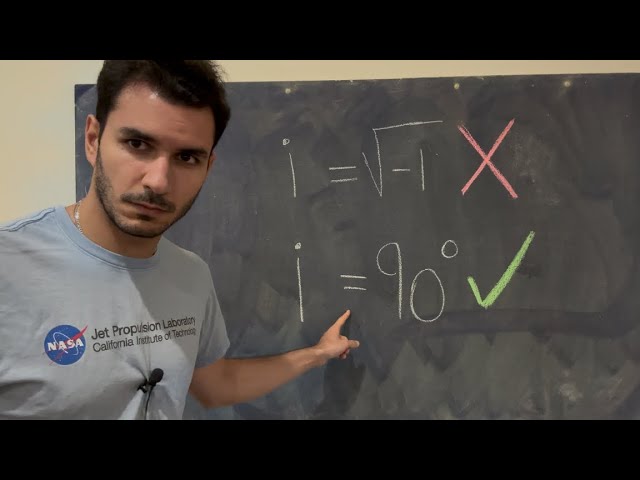
I'm Ali Alqaraghuli, a postdoctoral fellow working on terahertz space communication. I make videos to train and inspire the next ...
742,771 views
1 year ago
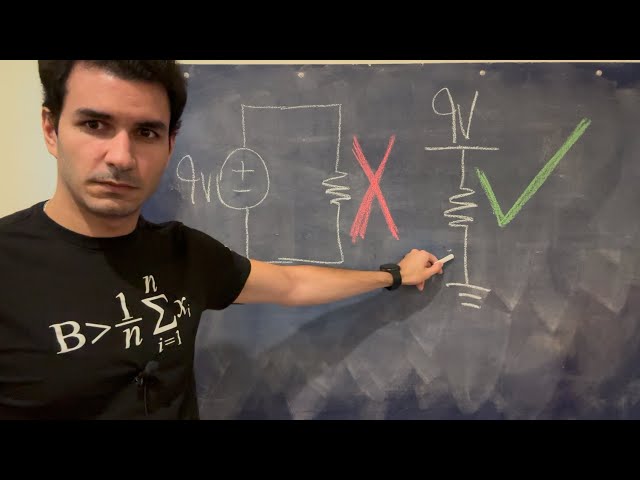
I'm Ali Alqaraghuli, a NASA postdoctoral fellow working on deep space communication. I make videos to train and inspire the next ...
631,177 views
9 months ago
260 views
2 years ago
133,363 views
84,072 views
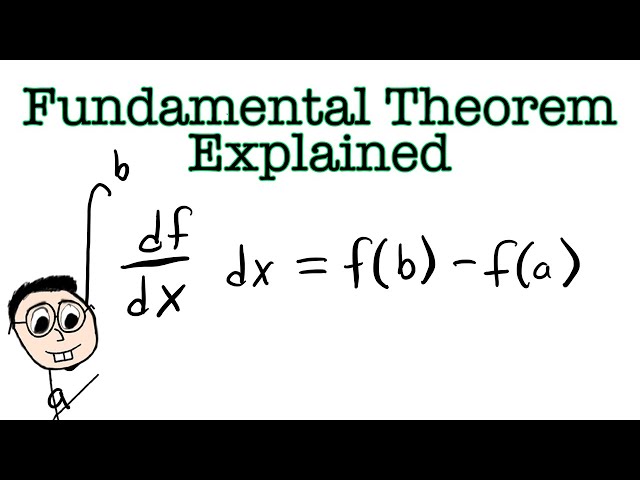
In this video, I provide an intuitive explanation of the Fundamental Theorem of Calculus. This is mainly geared towards students ...
12,319 views
This is the Bellman Equation. The one line that taught machines how to think about the future. From game-crushing AI like ...
5 views
6 months ago
54 views
Data Bite: Ever wondered what the difference between graph, plot, and chart is? Or even if there is a difference? Check this quick ...
19 views
9 views
1 month ago
Explore how three-circle Venn diagrams visually represent complex relationships between three sets. Learn to analyze ...
119 views
3 years ago
Seeing S³ as two solid tori glued along their boundary. The cleanest way I know to visualize a Heegaard splitting.
401 views
2 months ago
... you kind of keep that visualization like in your mind it helps it to make sense so therefore this first one I'm going to go ahead and ...
509 views
Our plot plot the layer striking this here this is the you know 2D visualization of the This Plane okay how we will you know interpret ...
170 views
46 views
Headline: Day 14: The Secret to Mastering Math Fast! | Math Expert Journey Welcome back to Day 14 of my Math Expert ...
18 views
8 views
4 years ago
CALM STATE GIVES POWER | How I Visualized My A-Level Maths Success In this video, I share a powerful personal story about ...
68 views
A pie chart is a powerful data visualization tool that represents data as slices of a circular graph. Each slice corresponds to a ...
10 months ago