Upload date
All time
Last hour
Today
This week
This month
This year
Type
All
Video
Channel
Playlist
Movie
Duration
Short (< 4 minutes)
Medium (4-20 minutes)
Long (> 20 minutes)
Sort by
Relevance
Rating
View count
Features
HD
Subtitles/CC
Creative Commons
3D
Live
4K
360°
VR180
HDR
185,583 results
Example code: https://rebrand.ly/kg1qk17 Chapters 00:00 - Intro to Matplotlib 00:29 - Install Matplotlib 00:35 - Import pyplot ...
8,666 views
1 year ago
In matplotlib, blitting is a technique that's used to make real-time updating of data much faster. This can be especially useful when ...
1,552 views
2 years ago
In this video we learn how to visualize 3D plots in Matplotlib. ◾◾◾◾◾◾◾◾◾◾◾◾◾◾◾◾◾ Programming Books ...
144,958 views
4 years ago
Learn matplotlib in this data science programming tutorial. Learn how to plot line graphs and histograms in Python using the ...
191,220 views
6 years ago
python #coding #matplotlib Matplotlib is a Python library used for data visualization. It provides a MATLAB-like interface for quick ...
23,879 views
4 months ago
Today we learn a fundamental data science skill. We learn how to animate plots using Matplotlib in Python.
197,669 views
Visualization is central to the process of how we think. This video reviews the inner workings of Python's most popular plotting ...
3,796 views
5 years ago
Master AI from Zero to Advanced: https://ailearninghub.io ------------------------- In this video, you'll learn the fundamentals of creating ...
810 views
9 months ago
Learn to plot graphs in Python in this tutorial! We cover matplotlib and show you how to get an awesome looking plot. As part of ...
55,974 views
In this video tutorial, you will learn how to make multiple line graph in Python using Matplotlib. You will learn how to filter and ...
1,925 views
Complete SciPy 2015 Talk & Tutorial Playlist here: http://ow.ly/PHjEN.
174,210 views
10 years ago
notebook used in this tutorial: https://github.com/codebasics/py/blob/master/matpltlib/1_intro/1_matplotlib_introduction.ipynb ...
187,520 views
8 years ago
Learn to build an interactive app with matplotlib graphs, dropdowns and tables with Plotly Dash.
15,483 views
Today we learn how to make our Matplotlib visualizations interactive by using widgets.
23,553 views
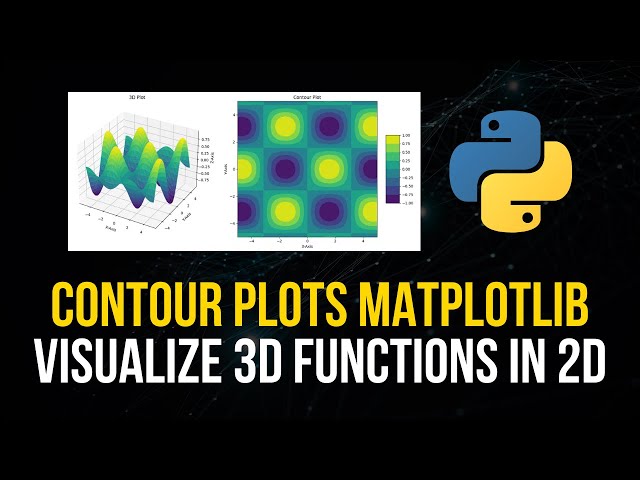
In this video we learn how to create contour plots in Python with Matplotlib. ◾◾◾◾◾◾◾◾◾◾◾◾◾◾◾◾◾ Programming ...
4,607 views
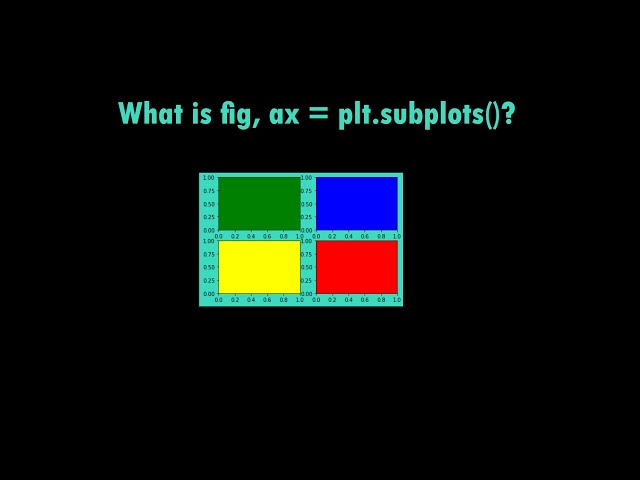
What is subplot fig, ax actually for? As a beginner you come across this a lot, but dont really know what it does and what it is used ...
33,996 views
3 years ago
A quick project based on a real job from Upwork. Code on GitHub: ...
3,231 views
In this video, we will be learning how to create histograms in Matplotlib. This video is sponsored by Brilliant.
208,044 views
python #coding #matplotlib In this video I will show you how to create subplots using Matplotlib.
7,714 views
3 months ago
In this video, you'll learn about customizing plots using Matplotlib. Matplotlib is essential to Machine Learning! It allows you to ...
1,578 views
Master Matplotlib for your next data science interview! This comprehensive tutorial covers everything you need to know about ...
159 views
In this video, we're speed-running the creation of an animated line graph visualization comparing AMD, Intel, and Nvidia stock ...
15,073 views
Welcome to a Matplotlib with Python 3+ tutorial series. In this series, we're going to be covering most aspects to the Matplotlib data ...
700,540 views
Python Code: import matplotlib.pyplot as plt x = [1, 2, 3, 4, 5] y = [1, 4, 9, 16, 25] plt.plot(x, y, linewidth=3, marker='+', color='green') ...
11,952 views
Unlock the power of advanced data visualisation with Matplotlib! In this tutorial, we dive deep into heatmaps and radial ...
1,451 views