Upload date
All time
Last hour
Today
This week
This month
This year
Type
All
Video
Channel
Playlist
Movie
Duration
Short (< 4 minutes)
Medium (4-20 minutes)
Long (> 20 minutes)
Sort by
Relevance
Rating
View count
Features
HD
Subtitles/CC
Creative Commons
3D
Live
4K
360°
VR180
HDR
4,969 results
Check out our weekly system design newsletter: https://bit.ly/3tfAlYD Checkout our bestselling System Design Interview books: ...
157,663 views
3 years ago
Keep your computer safe with BitDefender: https://bit.ly/BitdefenderNC (59% discount on a 1 year subscription) Here are the top ...
4,211,375 views
Review code better and faster with my 3-Factor Framework: https://arjan.codes/diagnosis. This video is a quick guide to ...
91,428 views
1 year ago
If you're still using console.log() to find and fix JavaScript issues, you might be spending more time debugging than you need to.
907,445 views
8 years ago
This video walks you through the steps to debug a C++ project in Visual Studio Code. Find more "Hello World" tutorials for ...
362,209 views
5 years ago
Coroutines bring new challenges when it comes to debugging - regular stack traces aren't much help when the async work was ...
3,570 views
9 months ago
... Robert is joined by Leslie Richardson, who shows several ways you can get the most out of Visual Studio's debugging tools.
34,399 views
6 years ago
Barry joins Jecelyn again to explain how to record a trace in the Performance panel and debug LCP and CLS issues using the ...
34,103 views
Harshada will demonstrate a few productive Debugging Tips and Tricks. From breakpoints to object visualization, we'll explore ...
18,588 views
This video will give you an overview of many debugging techniques and tools for C/C++ applications. This includes unit testing ...
5,445 views
4 years ago
This video was originally sponsored by ITProTV. We've since launched NetworkChuck Academy, our own place to learn IT: ...
2,865,973 views
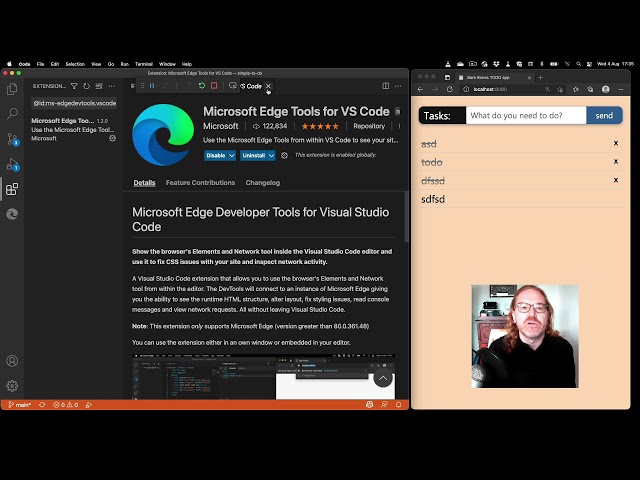
Debugging front-end apps with is now easier than ever with tooling integrated into Visual Studio Code and the new ...
39,589 views
Software Engineering Project 3.
48 views
In this guide I will show you how to install and implement ADB commands in Windows Teminal or PowerShell (Windows 11 and ...
704,256 views
You can use IntelliTrace to debug your complex applications quickly and more efficiently. IntelliTrace will record and track your ...
17,111 views
Build & debug C++ on WSL 2 with Visual Studio 2022 and VS Code. In this step-by-step guide you'll enable WSL 2, install the ...
1,282 views
4 months ago
This video is part of an online course, Software Debugging. Check out the course here: https://www.udacity.com/course/cs259.
38,699 views
11 years ago
When unexpected errors occur in your managed application you are often left with little evidence of the issue; capturing and ...
58,383 views
This video is part 7 of the Dart and Flutter Getting Started tutorial series. Learn about Dart and Flutter devtools. Start the written ...
15,628 views
3 days ago
13,470 views