Upload date
All time
Last hour
Today
This week
This month
This year
Type
All
Video
Channel
Playlist
Movie
Duration
Short (< 4 minutes)
Medium (4-20 minutes)
Long (> 20 minutes)
Sort by
Relevance
Rating
View count
Features
HD
Subtitles/CC
Creative Commons
3D
Live
4K
360°
VR180
HDR
5 results
If you enjoy business rankings, global economy stats, and data visualization, don't forget to SUBSCRIBE! #JapaneseCompanies ...
0 views
16 minutes ago
Power BI is Microsoft's business intelligence and data visualization platform. It helps individuals and organizations turn raw data ...
15 minutes ago
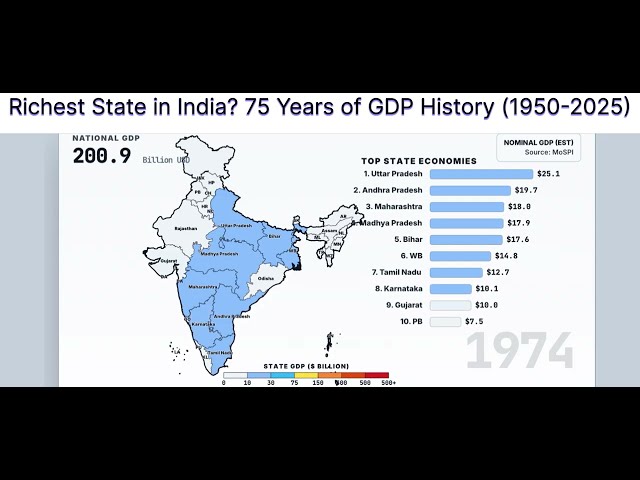
In this unique data visualization, we don't just look at numbers—we watch history unfold. See the massive original 1940s states ...
30 minutes ago
... #MathEnthusiasts #DataVisualization #TechTutorial #YouTubeCreators #ContentCreation #LearnToCode #STEMEducation ...
58 minutes ago
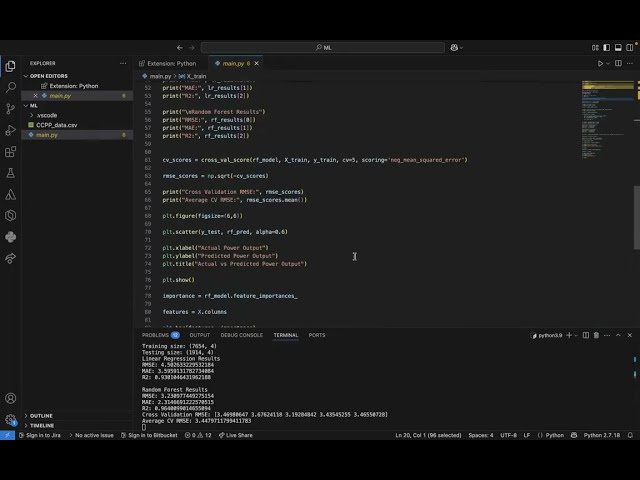
Predicting Electrical Energy Output of a Combined Cycle Power Plant Using Machine Learning This project demonstrates how ...
59 minutes ago