ViewTube

ViewTube
Sign inSign upSubscriptions
Filters

Upload date

Type

Duration

Sort by

Features

Reset

2,221 results

Jess Ramos | Data, AI, & Tech ⚡️
Watch Me Build a Data Analytics Project in 10 MINUTES (for beginners)

Grab this exact project template (Data Cleaning & Visualization): ...

11:16
Watch Me Build a Data Analytics Project in 10 MINUTES (for beginners)

6,110 views

5 days ago

Data Is Wonderful
Europe Population Ranking by Country (0 AD – 2026) | Historical Data Visualization

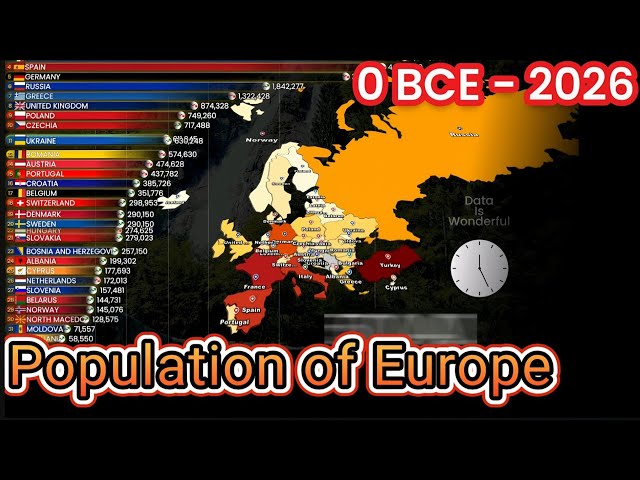
This video shows the population ranking of European countries from 0 AD to 2026 based on historical demographic estimates and ...

4:46
Europe Population Ranking by Country (0 AD – 2026) | Historical Data Visualization

136 views

6 days ago

Tothepoint Tutorials2
9 BEST Data Visualization Tools in 2026 in 2026

If you liked this video, you can support me here: https://ko-fi.com/marcusguidesyou or here: https://paypal.me/marcusstoneytb Or if ...

5:45
9 BEST Data Visualization Tools in 2026 in 2026

0 views

6 days ago

Data with Baraa
Data analyst vs data engineer in 2026 (Which Career Should You Choose?)

Data Analyst or Data Engineer in 2026? In this video, I break down the real differences, skills, salaries, and career paths to help ...

13:46
Data analyst vs data engineer in 2026 (Which Career Should You Choose?)

22,948 views

5 days ago

Data Visual Studio
🥑 Avocado Production (1961–2022) | Bar Chart Race | Data Visualization

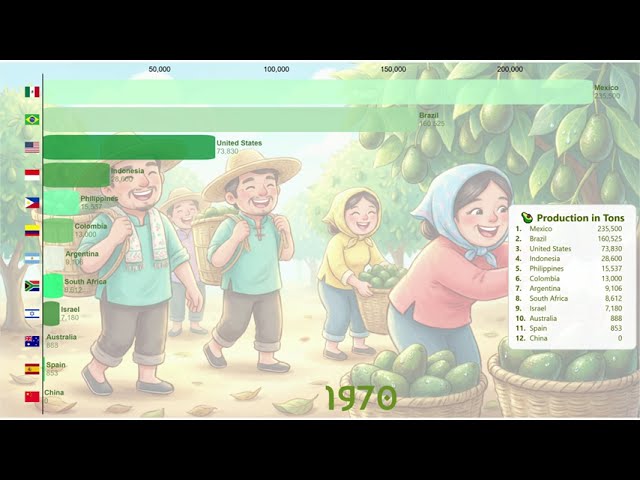
From a simple fruit to a global obsession — avocados have taken over the world! Watch how avocado production has ...

8:08
🥑 Avocado Production (1961–2022) | Bar Chart Race | Data Visualization

8 views

5 days ago

Cities of the World
Scandinavian City growth | Historic Racing Bar Visualization of the period 1900 - 2026.

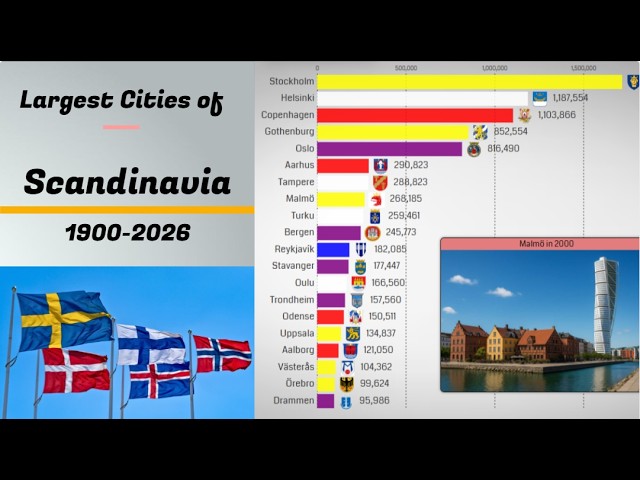
I like to analyze these trends in a statistical way, using data visualization tools such as charts and racing bar charts to bring urban ...

5:17
Scandinavian City growth | Historic Racing Bar Visualization of the period 1900 - 2026.

185 views

4 days ago

Thu Vu
Don’t choose the WRONG career (Data Scientist vs. ML Engineer vs. AI Engineer)

Get started with SerpApi for free https://serpapi.link/thu-vu Master Python and Build Awesome AI Projects ...

15:07
Don’t choose the WRONG career (Data Scientist vs. ML Engineer vs. AI Engineer)

10,846 views

5 days ago

My Data
World Apricot Production by Country | Global Data

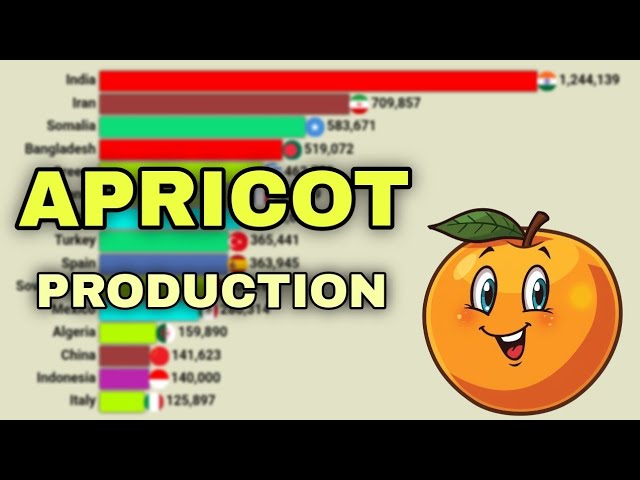
... Global apricot farming and agriculture data This video is helpful for students, researchers, agriculture lovers, data visualization ...

8:16
World Apricot Production by Country | Global Data

15 views

4 days ago

BioTech Whisperer
Exploratory Data Analysis and Visualisation (12 Minutes)

In this video, we explore "Exploratory Data Analysis and Visualization: A Beginner's Guide." Exploratory Data Analysis (EDA) is a ...

11:45
Exploratory Data Analysis and Visualisation (12 Minutes)

0 views

4 days ago

Technology Whisper
Collecting Biological Data For Experimental Analysis (13 Minutes)

... Bias in Biological Data, The Importance of Documentation in Research, How to Use Data Visualization in Biological Research, ...

13:00
Collecting Biological Data For Experimental Analysis (13 Minutes)

2 views

4 days ago

Lore So What
I Tried 50 Data Analyst Courses. Here Are Top 5

These are my top suggestions for data analyst courses that will help you get the skills fast and land a job offer in data. Data analyst ...

7:51
I Tried 50 Data Analyst Courses. Here Are Top 5

1,183 views

4 days ago

ChartGen
AI Data Visualization in Seconds- Turn Raw Data into Charts Automatically (No Coding)

What if your data could explain itself? In this video we demonstrate how AI data visualization is changing the way people analyze ...

4:12
AI Data Visualization in Seconds- Turn Raw Data into Charts Automatically (No Coding)

0 views

4 days ago

Siddhant
Storytelling through data visualization

Assignment.

4:00
Storytelling through data visualization

0 views

4 days ago

Dr Selena Fisk
Which data viz is the best for me to use? | Dr Selena Fisk

We've all been there: you've got data, you've got a message… and then you freeze at the chart menu. In this video, Dr Selena Fisk ...

10:41
Which data viz is the best for me to use? | Dr Selena Fisk

13 views

5 days ago

Kahan Data Solutions
Data Architecture 101: The 5 Key Questions

Learn more about how I help small data teams build modern architectures https://bit.ly/kds-advising ----- If you're a data leader ...

8:53
Data Architecture 101: The 5 Key Questions

892 views

6 days ago

Rajkumar D
Pros  and Cons of Data Visualization | Data Visualization | SNS Institutions

snsinstitutions #snsdesignthinkers #designthinking Data visualization transforms raw data into intuitive visuals, aiding analysis but ...

7:16
Pros and Cons of Data Visualization | Data Visualization | SNS Institutions

0 views

6 days ago

Dynamic boi
Data visualization part 1
10:12
Data visualization part 1

8 views

7 days ago

Med Research
AI-Powered Data Visualization Toolbox: From Visualization to Analysis

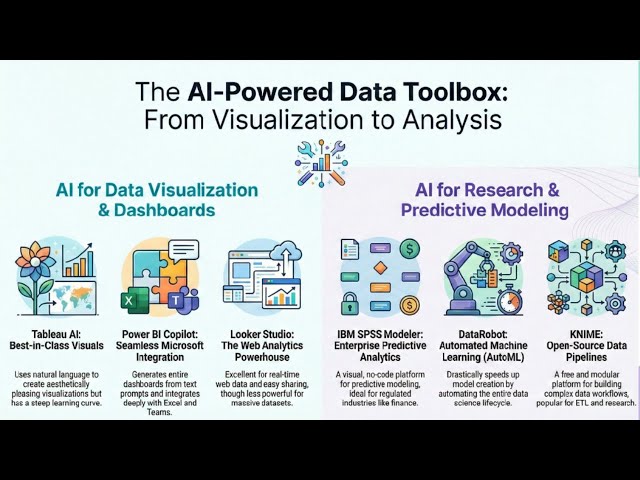
AI-Powered Data Visualization Toolbox: From Visualization to Analysis In today's data-driven world, visualization is no longer just ...

10:09
AI-Powered Data Visualization Toolbox: From Visualization to Analysis

29 views

6 days ago

Everything Data with Doyin
How to Break Into Data Analytics From Zero (2026)

Breaking into data analytics with zero experience isn't impossible—you just need the right roadmap. This video reveals the exact ...

8:31
How to Break Into Data Analytics From Zero (2026)

3,093 views

6 days ago

Rank the World
Top 5 Global Leaders in Cement Production 1980–2025

This data visualization video shows Top 5 Global Leaders in Cement Production 1980–2025 For new videos, Stay connected with ...

8:11
Top 5 Global Leaders in Cement Production 1980–2025

7,956 views

4 days ago