Upload date
All time
Last hour
Today
This week
This month
This year
Type
All
Video
Channel
Playlist
Movie
Duration
Short (< 4 minutes)
Medium (4-20 minutes)
Long (> 20 minutes)
Sort by
Relevance
Rating
View count
Features
HD
Subtitles/CC
Creative Commons
3D
Live
4K
360°
VR180
HDR
1,455,975 results
Build an interactive Excel dashboard for better data visualization in less than 20 minutes. ❗Master Excel with my courses: ...
74,963 views
1 year ago
Data Visualization Monthly Budget Tracker https://shorturl.at/fhlwz.
62,720 views
3 years ago
In this video, you'll learn how to visualize data totals, trends, geographical data, and more with Excel's TOP 5 data visualization ...
6,968 views
2 years ago
AD: Sign up to enroll for a 7-day free trial with Coursera now!
3,051,367 views
Learn Data Analysis Essentials in Excel in Just 12 minutes! Take our Data Analyst Program here: ...
154,791 views
11 months ago
... DOWNLOAD Free Excel file for this video: https://view.flodesk.com/pages/63dd44d5781752946ff2af78 In this video we'll build a ...
1,740,265 views
In this step-by-step tutorial, learn how to create dynamic and interactive Excel dashboards. With a dashboard, you can showcase ...
3,517,641 views
4 years ago
... Free Excel file for this video: https://careerprinciples.myflodesk.com/mssfixa655 In this video, I make 3 McKinsey visuals in Excel ...
443,944 views
Try think-cell for free: https://tinyurl.com/xelplus Create professional business charts in Excel—start here ...
614,808 views
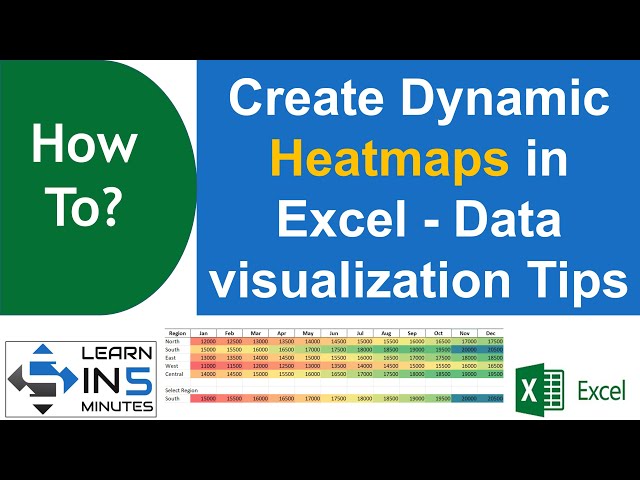
Learn how to create and customize dynamic heat maps in Excel to analyze and visualize your data like a pro! In this tutorial, I'll ...
375 views
In this tutorial, I'll guide you step-by-step on how to create and use pivot tables, one of Excel's most powerful features for ...
1,030,818 views
Build Dynamic Pie Charts & Filter with Slicers in Excel! (Easy Guide) Unlock hidden insights from your data with interactive pie ...
31,962 views
In today's tutorial from Pharos Technology, we're diving into the versatile world of conditional formatting in Microsoft Excel.
11,848 views
Make a Full Data Analysis Project in Excel! Take our Excel Course: ...
202,065 views
Sign up for our Excel webinar, times added weekly: https://www.excelcampus.com/blueprint-registration/ PART 1: ...
15,230,374 views
10 years ago
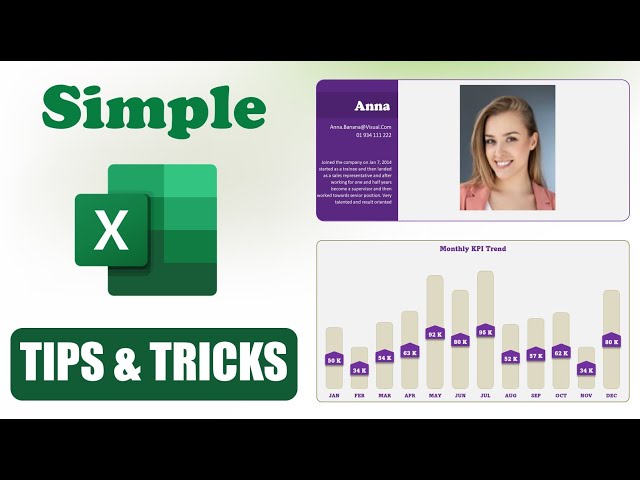
Simple excel data visualization tips & tricks that you can learn and apply quickly. Chapters 00:00 Intro 00:14 Using shapes in a ...
8,684 views
Data Visualization using Ms Excel #datavisualization #charts #chartsinexcel #barchart #columnchart #piechart #scatterplot ...
480 views
Welcome to our Data Analytics Tutorial Series! Whether you're a beginner or looking to enhance your skills, this tutorial ...
14 views
DATA VISUALIZATION IN MS EXCEL.
16 views
7 months ago
Join our popular FREE Power BI beginners course today https://link.xelplus.com/yt-d-visuals-powerbi-starter Dive into the world ...
548,996 views