ViewTube

ViewTube
Sign inSign upSubscriptions
Filters

Upload date

Type

Duration

Sort by

Features

Reset

21,129 results

Kenji Explains
Learn 80% of Data Analysis in Excel in Just 12 Minutes

Learn Data Analysis Essentials in Excel in Just 12 minutes! Take our Data Analyst Program here: ...

12:09
Learn 80% of Data Analysis in Excel in Just 12 Minutes

153,081 views

11 months ago

Lanret Academy
DATA VISUALIZATION IN MS EXCEL

DATA VISUALIZATION IN MS EXCEL.

9:53
DATA VISUALIZATION IN MS EXCEL

16 views

7 months ago

Gurru Tech Solutions
Nano Banana + Gemini 3: AI Data Visualization That Actually Works

Nano Banana + Gemini 3: The Data Visualization Workflow You Need | Stop Making Boring Charts – Use This Nano Banana + ...

10:14
Nano Banana + Gemini 3: AI Data Visualization That Actually Works

23,268 views

1 month ago

Excel Campus - Jon
Google's New AI Creates Dashboards at INSANE Speeds

Save 75% on our AI Literacy for Excel Course during Black Friday/Cyber Monday ...

9:22
Google's New AI Creates Dashboards at INSANE Speeds

73,307 views

1 month ago

Kevin Stratvert
Copilot Excel Tutorial - Excel’s Biggest Upgrade Ever

Microsoft Excel just got a game-changing upgrade with Copilot, your AI-powered assistant! In this video, I'll show you how to ...

16:14
Copilot Excel Tutorial - Excel’s Biggest Upgrade Ever

269,229 views

9 months ago

Ms Excel
Create Professional Excel Dashboard in just 10 Minutes || Interactive & Dynamic #excel #dashboard

We're bringing you the best Excel tips and tricks to help you become a spreadsheet expert! Don't forget to hit that like button to ...

13:40
Create Professional Excel Dashboard in just 10 Minutes || Interactive & Dynamic #excel #dashboard

264,872 views

3 months ago

Leila Gharani
Python in Excel: The Smarter Way to Use External Data

New course: Learn Python in Excel — already 2500+ enrolled. Solve real data problems, right inside Excel ...

10:42
Python in Excel: The Smarter Way to Use External Data

164,708 views

8 months ago

Collaboration Simplified
Major COPILOT in EXCEL Advancements! Now Everyone Can Be an Excel EXPERT

Master Microsoft Copilot in Excel, from basics to advanced AI & Python analysis. Microsoft 365 Copilot is changing the way we ...

14:37
Major COPILOT in EXCEL Advancements! Now Everyone Can Be an Excel EXPERT

137,894 views

9 months ago

Kenji Explains
How Modern Analysts Actually Use Excel (10 Key Skills)

In this video we go over 10 Excel Skills the Modern Analyst should know! Take our Data Analyst Program: ...

17:28
How Modern Analysts Actually Use Excel (10 Key Skills)

46,922 views

1 month ago

Kenji Explains
Create Dashboards in Seconds With AI (It's Mind-Blowing 🤩)

... DOWNLOAD Free Excel file for this video: https://careerprinciples.myflodesk.com/cjuvk76zax In this video, we go over 4 different ...

9:59
Create Dashboards in Seconds With AI (It's Mind-Blowing 🤩)

150,195 views

8 months ago

DR EXCEL
Create an Interactive Dashboard in Excel with US Map | Data Visualization Tutorial

ExcelDashboard #DataVisualization #ExcelTutorialLearn how to create a professional interactive Excel dashboard featuring a ...

14:14
Create an Interactive Dashboard in Excel with US Map | Data Visualization Tutorial

150 views

2 months ago

Gray Technical
3D Graphs in Excel Tutorial – Easy Data Visualization

Create stunning 3D graphs directly in Excel using XYZ Mesh! This tutorial shows you step-by-step how to transform simple XYZ ...

4:38
3D Graphs in Excel Tutorial – Easy Data Visualization

1,211 views

7 months ago

Christine Jiang
Data Storytelling 101 | Think Like a Data Analyst

MENTORSHIP – Applications for the March 2026 cohort are now open! Apply here → https://theanalyticsaccelerator.com/ We're ...

12:55
Data Storytelling 101 | Think Like a Data Analyst

41,999 views

9 months ago

Mo Chen
How to Use EXCEL for DATA ANALYSIS

Excel Fundamentals: https://datacamp.pxf.io/RGjK1v How I Built 50+ Data Projects in 90 DAYS: ...

15:36
How to Use EXCEL for DATA ANALYSIS

60,465 views

4 months ago

ViSIT
Excel & SQL Server Integration: Effortless Data Analysis, Visualization and Reporting

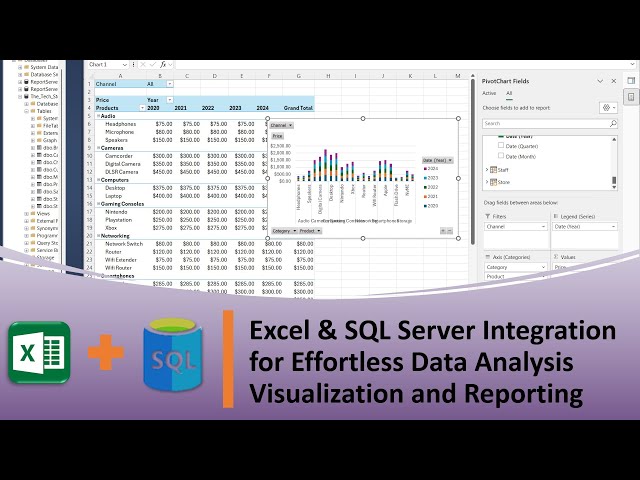
Tired of wrestling with complex SQL queries just to analyze your data? Welcome to this comprehensive tutorial where we'll unlock ...

18:57
Excel & SQL Server Integration: Effortless Data Analysis, Visualization and Reporting

484 views

8 months ago

Understand Office
Excel Master Course Episode 8: Building Powerful Charts for Data Visualization

Transform raw data into compelling visuals. Learn how to create and customize various types of charts in Excel to effectively ...

7:15
Excel Master Course Episode 8: Building Powerful Charts for Data Visualization

11 views

8 months ago

Vedakarna
Stop Using PivotTables the Old Way – Try These Advanced Tricks!

Welcome to VedaKarna! Download the Excel Practice File: ...

15:26
Stop Using PivotTables the Old Way – Try These Advanced Tricks!

247,911 views

6 months ago

Analyst Academy
Stop Sharing Data—Start Telling Stories

You'll learn: ✓ How to rethink chart types to highlight key insights ✓ The power of storytelling in data visualization ✓ Practical ...

19:08
Stop Sharing Data—Start Telling Stories

85,060 views

11 months ago

Mo Chen
Why Data Storytelling is the #1 Skill Employers Want in 2025 (+ HOW TO MASTER IT)

Timestamps 00:00 Data Storytelling is not the same as Data Visualization 01:38 Data Storytelling and 5 Key Business Impacts ...

11:45
Why Data Storytelling is the #1 Skill Employers Want in 2025 (+ HOW TO MASTER IT)

25,188 views

7 months ago

Bharat Ken
Data Visualization using Excel
17:12
Data Visualization using Excel

83 views

4 months ago