Upload date
All time
Last hour
Today
This week
This month
This year
Type
All
Video
Channel
Playlist
Movie
Duration
Short (< 4 minutes)
Medium (4-20 minutes)
Long (> 20 minutes)
Sort by
Relevance
Rating
View count
Features
HD
Subtitles/CC
Creative Commons
3D
Live
4K
360°
VR180
HDR
12,326,848 results
View full lesson: http://ed.ted.com/lessons/david-mccandless-the-beauty-of-data-visualization David McCandless turns complex ...
1,561,810 views
13 years ago
Setup, conflict, resolution. You know right away when you see an effective chart or graphic. It hits you with an immediate sense of ...
622,761 views
6 years ago
You've probably heard the term data visualization thrown around a lot. It's why you're here, isn't it? So let's make it clear — data ...
177,813 views
3 years ago
Data visualization is present in every aspect of our lives - but is it really as unbiased as it's said to be? In this SciToons video, learn ...
135,999 views
7 years ago
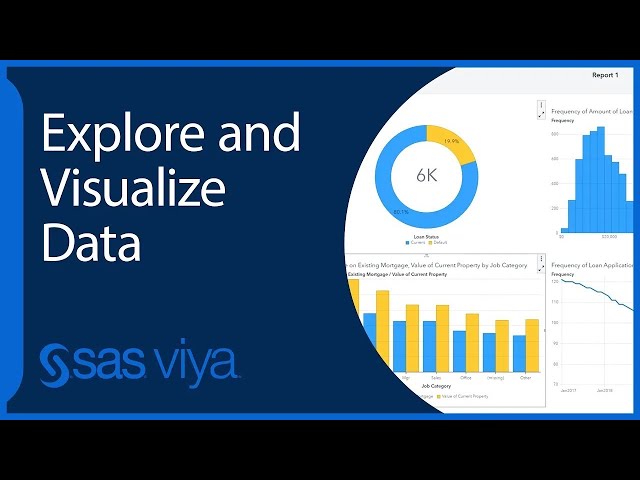
This Quick Start tutorial shows you how to explore and visualize data with SAS Visual Analytics. You learn how to access and ...
191 views
9 days ago
MENTORSHIP – Applications for the March 2026 cohort are now open! Apply here → https://theanalyticsaccelerator.com/ We're ...
45,156 views
9 months ago
Viewers like you help make PBS (Thank you ) . Support your local PBS Member Station here: http://to.pbs.org/Donateoffbook ...
508,226 views
12 years ago
Have you noticed the updates Power BI dataflows has had recently? Patrick explores Visual Data Prep which helps you craft your ...
11,934 views
5 years ago
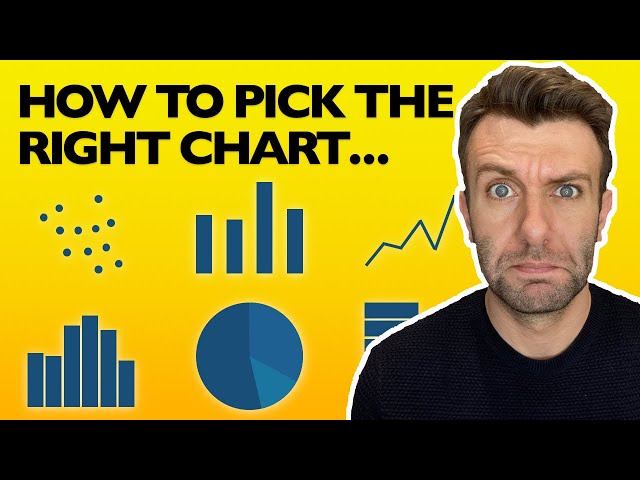
In this video I cover different world's five most popular types of graph and when they should be used. For example, a bar chart is ...
222,253 views
4 years ago
Apparently you lose all credibility by using Pie Charts , so in this video, I share 7 Data Storytelling Tips to Improve Your ...
218,938 views
In this video, we will demonstrate the difference between data visualization charts including: - Bar Chart - Line Chart - Bubble ...
186,965 views
Dustin hopes that the audience learns how anyone can use data visualization to improve their work, understand their world, and ...
72,141 views
Dale shows us 12 tips to design better dashboards. Whichever dashboard tool you are using, the lessons we cover in this video ...
263,678 views
Today we're going to start our two-part unit on data visualization. Up to this point we've discussed raw data - which are just ...
489,806 views
Working with numbers isn't usually considered sexy, but you can change that by learning more about data storytelling. These tips ...
221,651 views
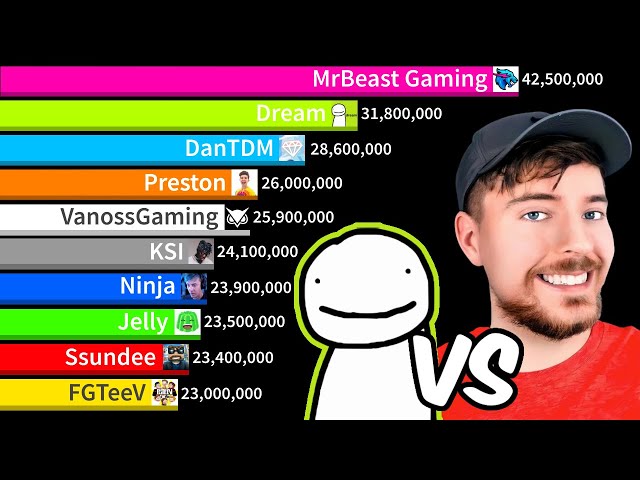
Dream Vs MrBeast Gaming Vs Gaming YouTubers! - Gas Gas Meme | Sub Count History (2009-2024) If you enjoyed, like and ...
89,650 views
1 year ago
This channel has been created to represent the data graphically – the most understandable way by humans.
80 views
Modeling and understanding human beings is pivotal to numerous applications ranging from 3D modeling for telepresence in ...
2,395 views
8 years ago
In our society's constant hunger for shocking and sensational news, we tend to overlook the importance of what is happening ...
122,305 views
Curious about a career in Data Analytics? Book a call with a program advisor: https://bit.ly/47LEBk3 What is the data analysis ...
993,959 views