Upload date
All time
Last hour
Today
This week
This month
This year
Type
All
Video
Channel
Playlist
Movie
Duration
Short (< 4 minutes)
Medium (4-20 minutes)
Long (> 20 minutes)
Sort by
Relevance
Rating
View count
Features
HD
Subtitles/CC
Creative Commons
3D
Live
4K
360°
VR180
HDR
2,372 results
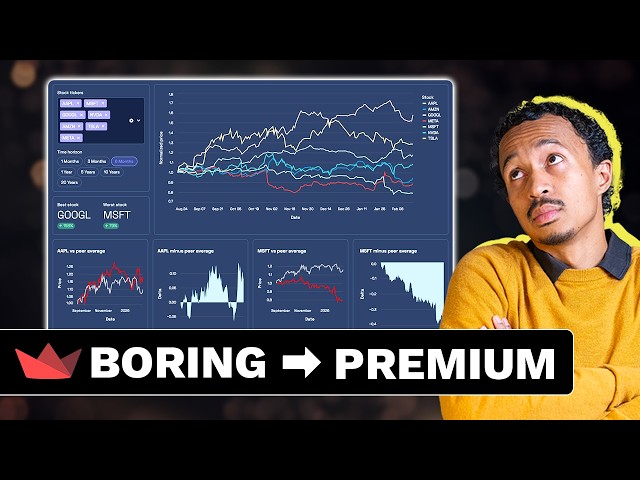
Stop building Streamlit apps that look like every other Streamlit app In this video, you will learn: * Advanced Dashboard ...
1,153 views
3 days ago
Grab this exact project template (Data Cleaning & Visualization): ...
5,082 views
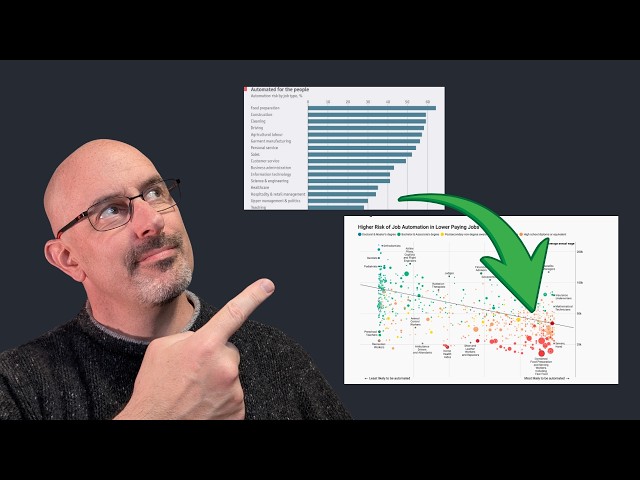
Most people misunderstand data visualization jobs. When you hear “data visualization,” you probably think dashboards, charts, ...
61 views
6 days ago
If you liked this video, you can support me here: https://ko-fi.com/marcusguidesyou or here: https://paypal.me/marcusstoneytb Or if ...
0 views
4 days ago
This video shows the population ranking of European countries from 0 AD to 2026 based on historical demographic estimates and ...
118 views
Learn how to use Excel's visualization tools to analyze and present data from Microsoft Project. This tutorial shows you how to ...
648 views
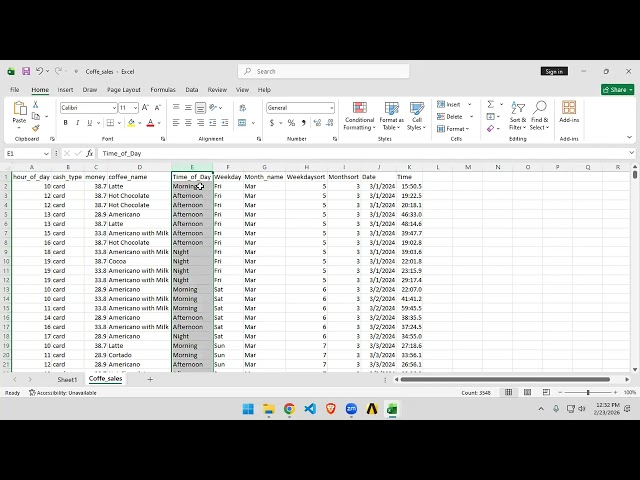
In this video, I share a powerful EDA (Exploratory Data Analysis) Cheatsheet using Pandas that will help you quickly analyze any ...
53 views
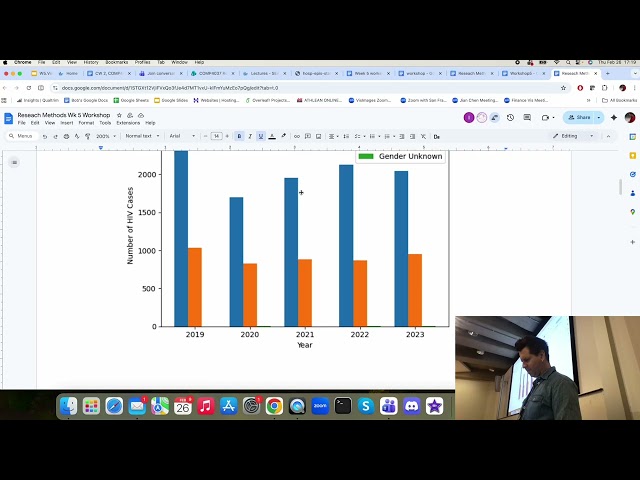
The YouTube channel dedicated to data visualization, research methods for computer scientists and other related topics. Connect ...
11 views
Video Review | Chapter 2: Making Sense of Data - Charts, Distributions & Interpretation This is your ultimate synthesis of Chapter ...
4 views
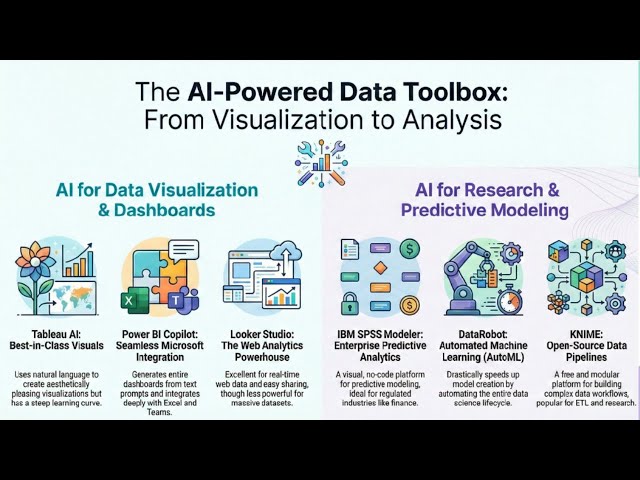
AI-Powered Data Visualization Toolbox: From Visualization to Analysis In today's data-driven world, visualization is no longer just ...
23 views
code link https://colab.research.google.com/drive/19dSHtZNX4EAuwZ6fQbK2geTAH6LMZ1SB?usp=sharing.
3 views
4 hours ago
8 views
5 days ago
If you want to become an ML Engineer, your projects either make you stand out or make you look average. In this video, I explain ...
502 views
2 days ago
... The Role of Data Collection in Research, How to Use Statistical Tools for Data Analysis, The Importance of Data Visualization in ...
Stop building slow batch pipelines! In this step-by-step tutorial, I'll show you how to build a complete real-time streaming analytics ...
517 views
... different data sets we're combining them and when we do all of that then you know it's easier if we just put it into a visualization ...
7 views
In this video, we explore "Exploratory Data Analysis and Visualization: A Beginner's Guide." Exploratory Data Analysis (EDA) is a ...
You learned SQL. You learned Excel. You learned Power BI. So why aren't you getting hired? In this video, I'm breaking down the ...
657 views
Media & Fair Use Notice This video may include publicly available NASA imagery, data visualizations, and educational graphics ...
72,343 views
1 day ago