Upload date
All time
Last hour
Today
This week
This month
This year
Type
All
Video
Channel
Playlist
Movie
Duration
Short (< 4 minutes)
Medium (4-20 minutes)
Long (> 20 minutes)
Sort by
Relevance
Rating
View count
Features
HD
Subtitles/CC
Creative Commons
3D
Live
4K
360°
VR180
HDR
11,505,751 results
Create charts that wow your audience. Learn the secrets now—start today! https://link.xelplus.com/yt-g-basics-charts-course ...
1,183,364 views
8 years ago
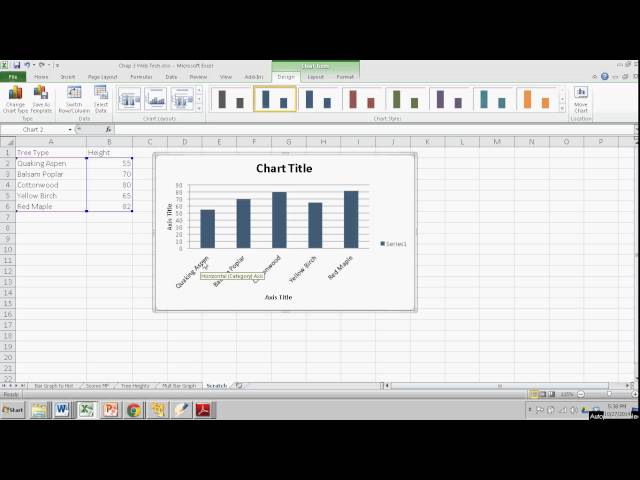
In this beginning level Excel tutorial, learn how to make quick and simple Excel charts that show off your data in attractive and ...
3,432,001 views
7 years ago
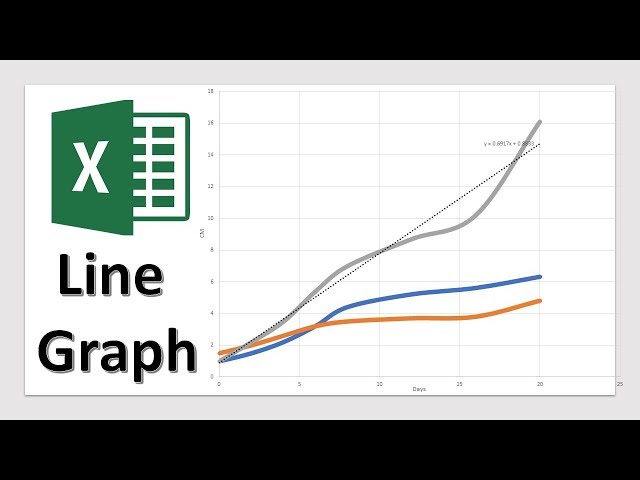
Learn Excel in just 2 hours: https://kevinstratvert.thinkific.com Learn how to create line charts in Microsoft Excel with this ...
1,214,943 views
6 years ago
Create advanced excel charts (forecast chart, waterfall chart, column chart etc.) Sign up to Morning Brew: ...
288,361 views
3 years ago
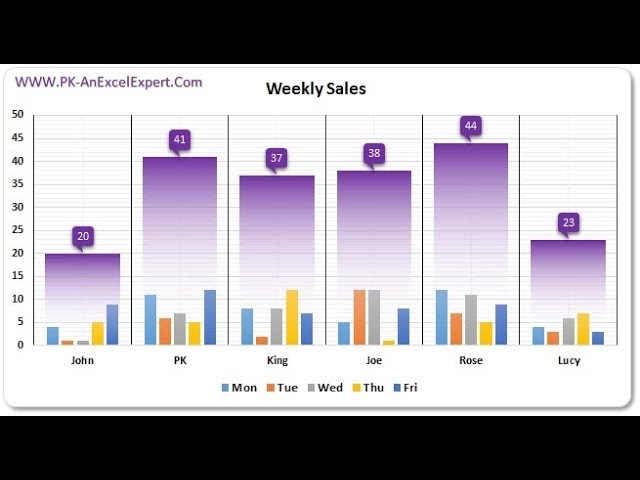
Hello Friends, In this video you will learn how to create a beautiful Weekly Sales Chart in Excel. Please download this excel file ...
453,857 views
Want more Excel videos? Here's my Excel playlist: ...
847,858 views
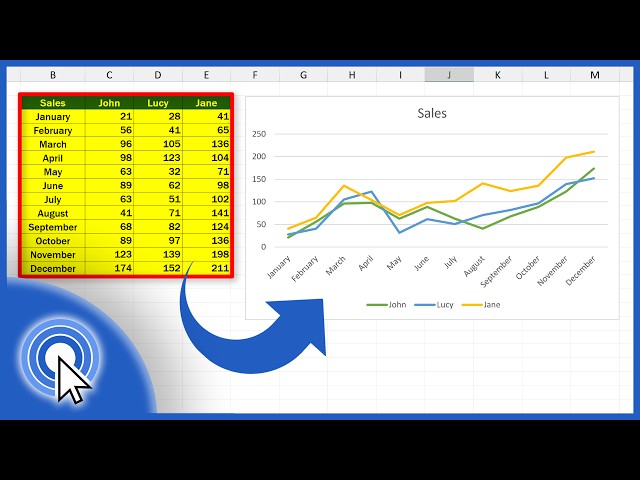
Learn how to create a line graph with multiple lines in Excel. First, we'll be going through how to create a line graph with two lines ...
127,024 views
1 year ago
Create charts that wow your audience. Learn the secrets now—start today! https://link.xelplus.com/yt-g-dyn-range-charts-course ...
369,095 views
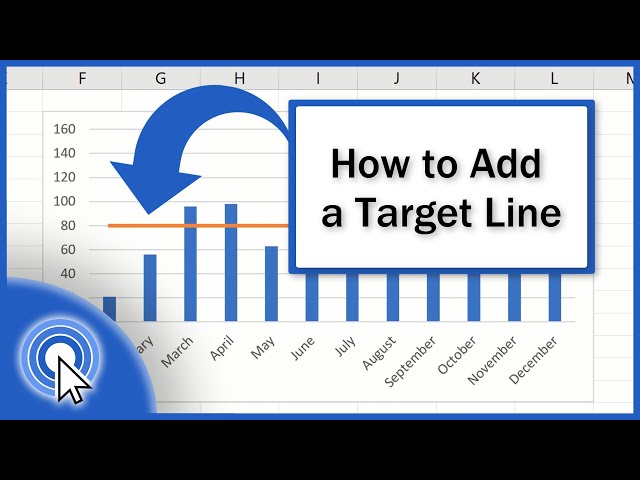
In this video tutorial, we'll have a look at how to add a target line in an Excel graph, which will help you make the target value ...
462,504 views
5 years ago
Try think-cell for free: https://tinyurl.com/xelplus Create professional business charts in Excel—start here ...
618,424 views
From "Introduction to Statistics, Think & Do" by Scott Stevens, Amazon: https://amzn.to/2zJRCjL This demonstration shows you ...
2,242,228 views
11 years ago
A brief tutorial on how to select several different data sets from a table and incorporate them into a chart for easier debriefing of ...
182,186 views
4 years ago
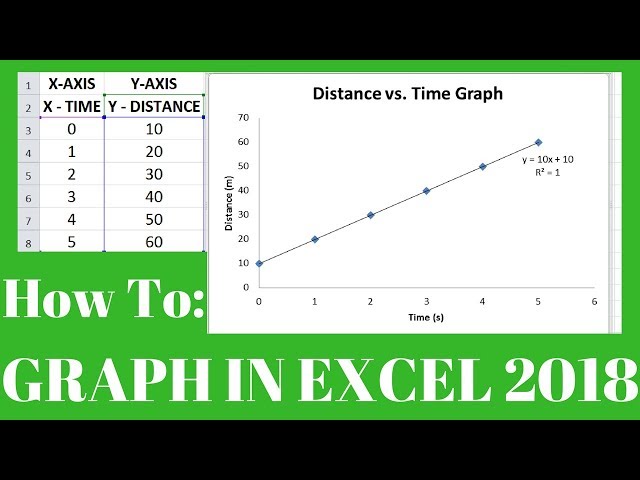
How to Make a Graph in Microsoft Excel 2018 - How to make a line graph in microsoft excel uses table of values, scatter plot, and ...
449,404 views
9 years ago
Four most popular Excel graph types: when & how they should be used. Learn more about the Excel Dashboard course: ...
25,178 views
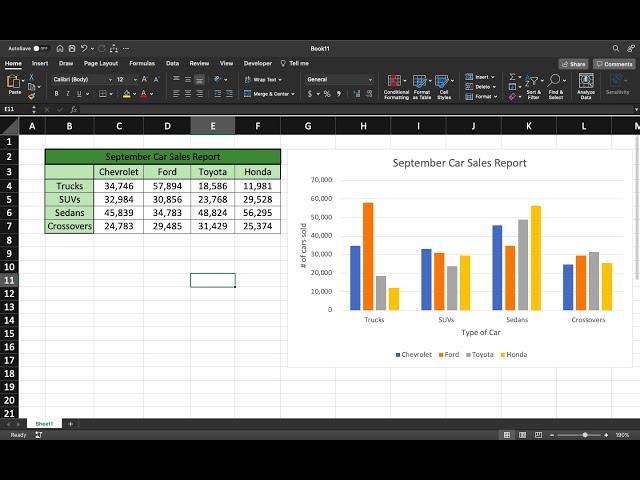
In this video, you will learn how to create different types of charts in Microsoft Excel, such as column charts, bar charts, stacked ...
384,204 views
2 years ago
If you have found this content useful and want to show your appreciation, please use this link to buy me a beer ...
48,556 views
Download the timeline chart template: https://pages.xelplus.com/timeline-chart-template Stop wrestling with PowerPoint. In this ...
567,779 views
2 months ago
In this video tutorial, you'll see a few quick and easy steps on how to add an average line in an Excel graph to visually represent ...
211,009 views
Learn Excel in just 2 hours: https://kevinstratvert.thinkific.com In this step-by-step tutorial, learn how to make a Gannt Chart in Excel ...
1,346,710 views
Create charts that wow your audience. Learn the secrets now—start today! https://link.xelplus.com/yt-g-stacked-charts-course ...
602,778 views
Learn how to show trends in Excel by using Excel charts and a couple of functions: trend and growth. You'll also learn how to ...
439,756 views
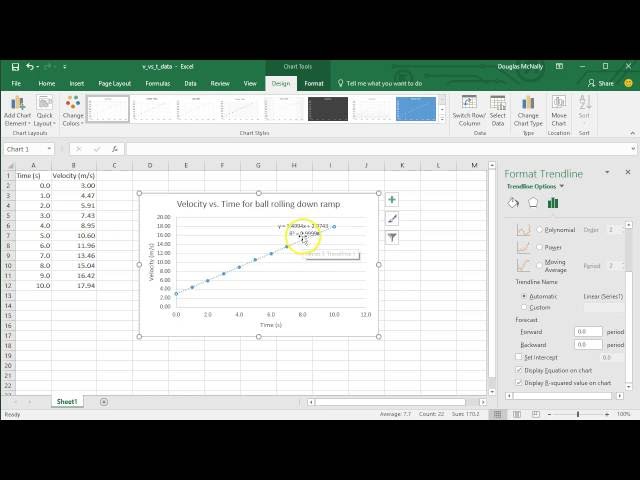
In this video I explain how to make a simple scatter plot in Microsoft Excel. I also demonstrate how to add a line of best fit or ...
234,657 views
Create two charts and line them up over the top of each other ...
688,576 views
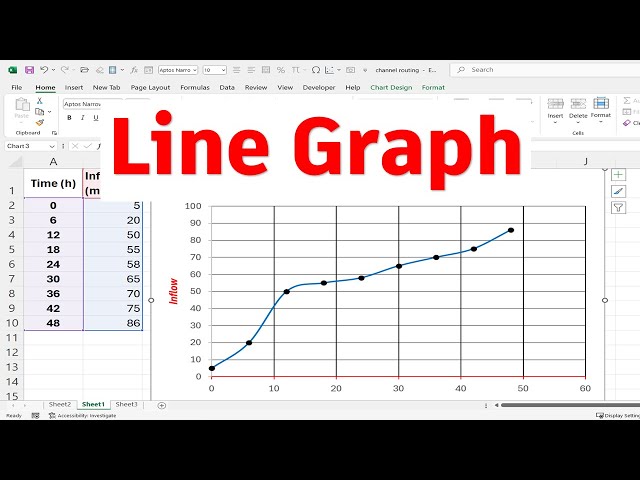
Ready to learn how to make a line graph in Excel — quickly and easily? In this step-by-step tutorial, I'll show you how to create a ...
595 views
3 months ago
One of the best features of Microsoft Excel is taking your information or data and creating a visual presentation of that data in the ...
44,271 views