Upload date
All time
Last hour
Today
This week
This month
This year
Type
All
Video
Channel
Playlist
Movie
Duration
Short (< 4 minutes)
Medium (4-20 minutes)
Long (> 20 minutes)
Sort by
Relevance
Rating
View count
Features
HD
Subtitles/CC
Creative Commons
3D
Live
4K
360°
VR180
HDR
144 results
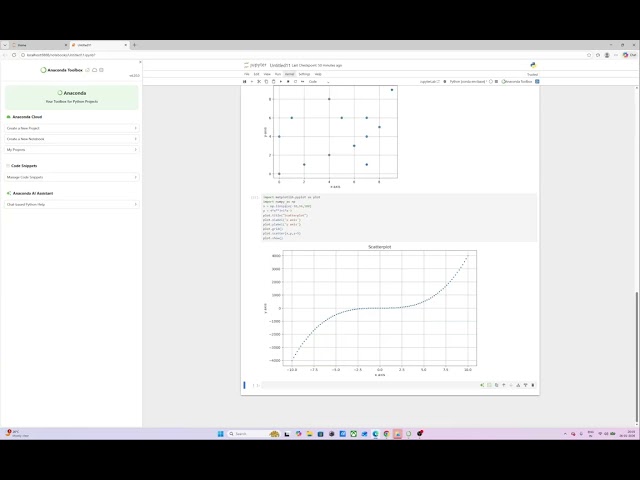
Our favourite plotting library may just be matplotlib again now that we made it interactive with a puck! It may sounds strange at first, ...
6,128 views
4 days ago
In this video, I show how to install Python libraries step by step, including OpenCV, MediaPipe, and Matplotlib, without confusion ...
23 views
2 days ago
0 views
6 days ago
What if you could draw the Google logo using Python? In this video, you'll learn how to create a colorful Google-style text ...
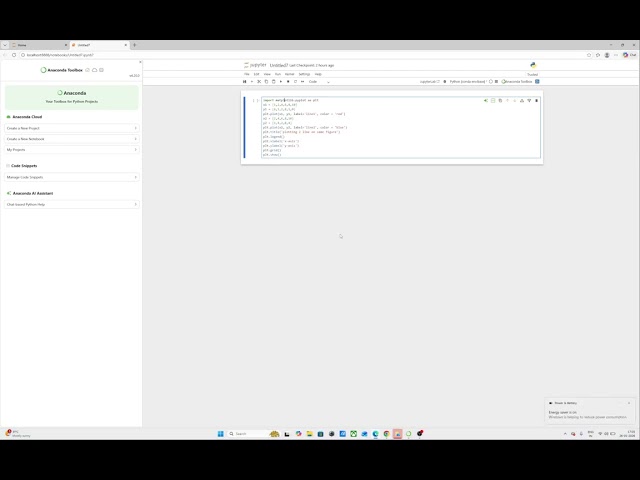
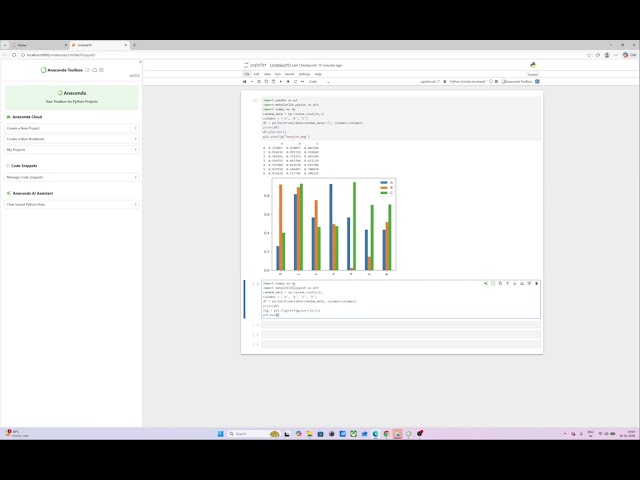
In this video, you will learn how to create different types of data visualization graphs using Python. We will cover popular graph ...
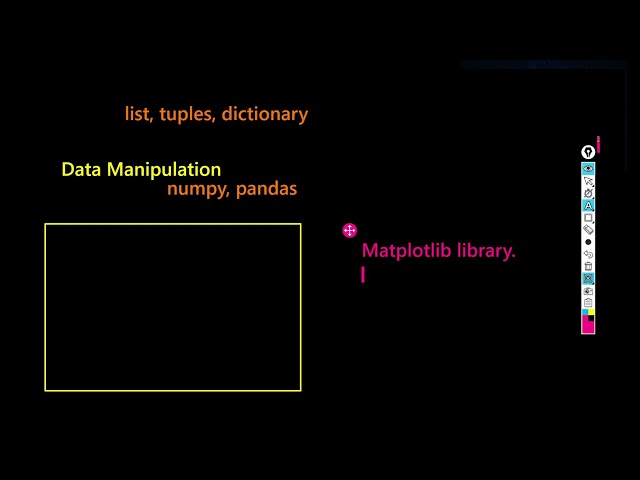
In this video, Numpy, Pandas, Matplotlib | Python Libraries, we cover the three most important Python libraries used in trading, ...
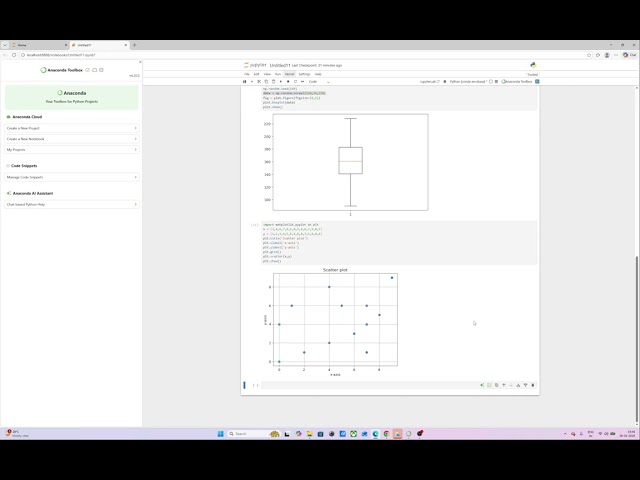
Data is only as good as your ability to communicate it! In this video, we step away from the terminal and into the world of data ...
12 views
1 day ago
This video is introductory video of plotting the graphs using matplotlib library.
3 days ago
In this video, you'll learn how to plot different line styles in Python for better and clearer data visualization. We demonstrate how to ...
9 views
5 days ago
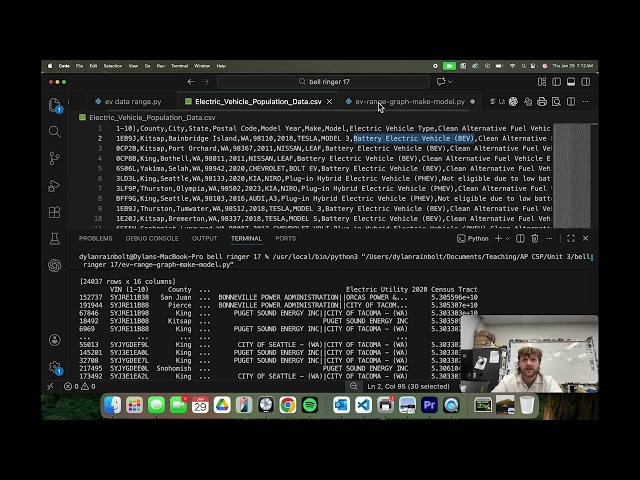
CSV Data can be found here: https://catalog.data.gov/dataset/electric-vehicle-population-data.
38 views
6 views
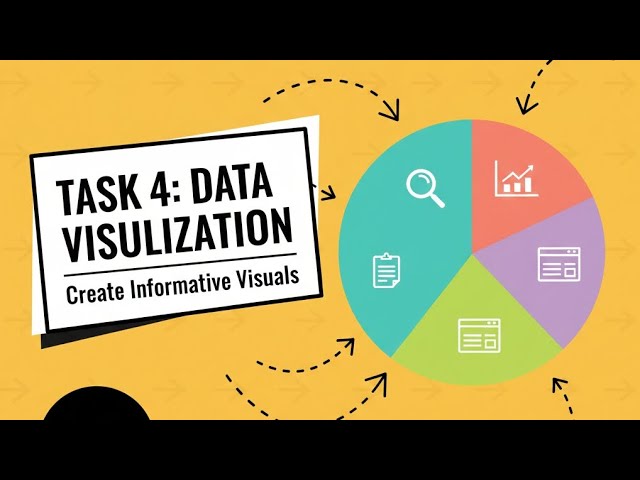
Task 4: Data Visualization Using Python | Matplotlib & Seaborn In this video, I have completed Task 4: Data Visualization as part ...
13 views
Class 12 IP - Plotting Data Using Matplotlib Chapter 3 | Kartik Sir ...
225 views
Streamed 1 day ago
Is video mein hum Multiple Plots aur Subplots using Matplotlib ko step-by-step seekhenge jo Data Visualization aur ...
12 hours ago