Upload date
All time
Last hour
Today
This week
This month
This year
Type
All
Video
Channel
Playlist
Movie
Duration
Short (< 4 minutes)
Medium (4-20 minutes)
Long (> 20 minutes)
Sort by
Relevance
Rating
View count
Features
HD
Subtitles/CC
Creative Commons
3D
Live
4K
360°
VR180
HDR
15,687 results
python #coding #matplotlib Matplotlib is a Python library used for data visualization. It provides a MATLAB-like interface for quick ...
24,024 views
4 months ago
Our favourite plotting library may just be matplotlib again now that we made it interactive with a puck! It may sounds strange at first, ...
6,219 views
5 days ago
Master AI from Zero to Advanced: https://ailearninghub.io ------------------------- In this video, you'll learn the fundamentals of creating ...
815 views
10 months ago
Learn how to build clean, minimalist charts using Python, Pandas, and Matplotlib—just like The Economist. Jupyter Notebook: ...
115 views
Master AI from Zero to Advanced: https://ailearninghub.io ------------------------- In this video, you'll learn how to create and customize ...
181 views
Master Matplotlib for your next data science interview! This comprehensive tutorial covers everything you need to know about ...
160 views
In this video we go over how to install the python library Matplotlib and how to test that the install was done correctly. Link to the ...
24 views
3 months ago
Making high-quality data visualizations can take hours - but it doesn't have to. We'll walk through a clean, efficient workflow for ...
187 views
In this video, we'll create a simple line graph in Python using Matplotlib to visualize global temperature changes from 1880 to ...
107 views
9 months ago
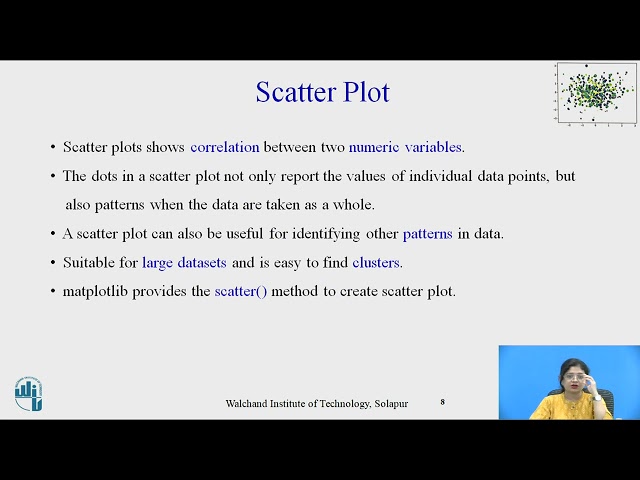
Mrs. Kanchan Ashish Khedikar Assistant Professor Department of Computer Science and Engineering Walchand Institute of ...
74 views
5 months ago
Python Code: import matplotlib.pyplot as plt x = [1, 2, 3, 4, 5] y = [1, 4, 9, 16, 25] plt.plot(x, y, linewidth=3, marker='+', color='green') ...
12,029 views
python #coding #matplotlib In this video I will show you how to create subplots using Matplotlib.
7,744 views
No module named 'matplotlib.backends.registry' (4 SOLUTIONS!!) ✧ I really hope you found a helpful solution! ♡ The Content is ...
81 views
11 months ago
94 views
datacleaning #dataprocessing #matplotlib #datavisualization #visualization Data Visualization with Matplotlib In this video, ...
42 views
python #coding #matplotlib This video serves as a project where we will create a bar chart based on the primary Type of the ...
7,769 views
python #coding #matplotlib In this video we will create a basic scatter plot using Matplotlib. Here is some sample data you can ...
6,807 views
Python offers several powerful libraries for data visualization. This is a detailed comparison of them: Matplotlib vs Seaborn vs ...
311 views
8 months ago
In this video, learn how to install matplotlib on Windows. We will also install Python 3 and pip. PIP is used to install and manage ...
2,314 views
2 months ago
Learn how to create a complete Sales Data Analysis project in Python. In this step-by-step tutorial, we will cover: Importing and ...
321 views
1 month ago


![How to Install Matplotlib with latest Python 3.14 on Windows 10/11 [2025 Update] Matplotlib Tutorial](/api/proxy/image?url=https%3A%2F%2Fi.ytimg.com%2Fvi%2FJqTjyPhRHMw%2Fsddefault.jpg)
