Upload date
All time
Last hour
Today
This week
This month
This year
Type
All
Video
Channel
Playlist
Movie
Duration
Short (< 4 minutes)
Medium (4-20 minutes)
Long (> 20 minutes)
Sort by
Relevance
Rating
View count
Features
HD
Subtitles/CC
Creative Commons
3D
Live
4K
360°
VR180
HDR
132,396 results
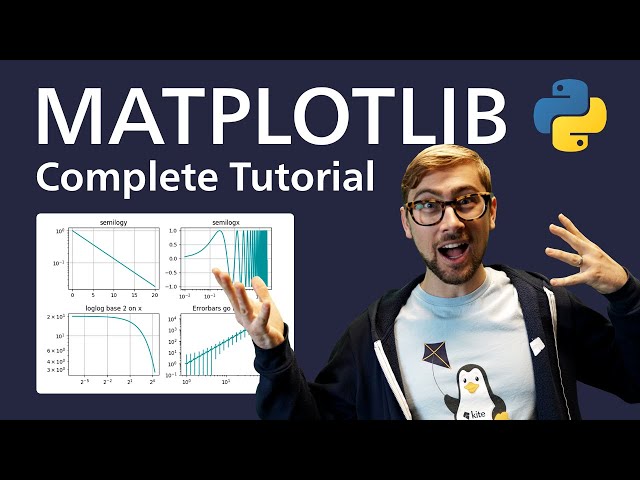
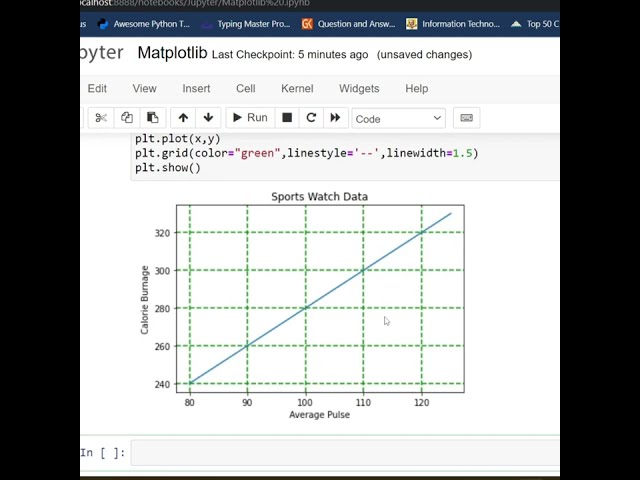
In this video we'll go over the Matplotlib library for Python. Matplotlib is a popular library for creating graphs, plots, and other data ...
168,180 views
5 years ago
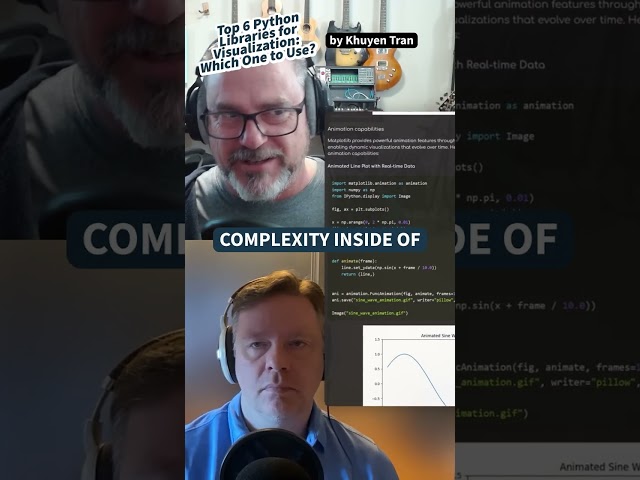
In this video, we dive deep into the world of data visualization in Python using three powerful libraries: Matplotlib, Seaborn, and ...
2,463 views
1 year ago
Matplotlib Explained in 100 Secs | Python Plotting for Beginners #MatplotlibPython #Matplotlib #MatplotlibPythonTutorial ...
52,736 views
7 months ago
Matplotlib vs Seaborn vs Plotly: Best Python Visualization Tools.
2,568 views
3 months ago
145,483 views
In this video I show you how to plot multiple lines using the matplotlib library in Python, and how to change the line's color #coding ...
3,304 views
2 years ago
3,212 views
Join me on Day 3/100 of my Python journey as I dive into Matplotlib, the powerful library for creating stunning data visualizations!
53,167 views
Matplotlib is the most fundamental and widely used data visualization library in Python, forming the backbone of libraries like ...
750 views
Learn how to use Matplotlib markers in Python for better data visualization. This quick Python plotting tutorial shows different ...
275 views
Learn how to create stunning scatter plots using Matplotlib in Python! In this tutorial, we'll walk you through the basics of scatter ...
246 views
9 months ago
In this lesson, learn what is Matplotlib with its features. Matplotlib is an open-source plotting library developed by John D. Hunter.
24,376 views
Hello guys, Welcome to my channel Mr. Scientist..... #shorts #python #pythonprogramming #coding #mrscientist #coding ...
29,418 views
3 years ago
automatic sliders to control matplotlib!
1,478 views
8,933 views
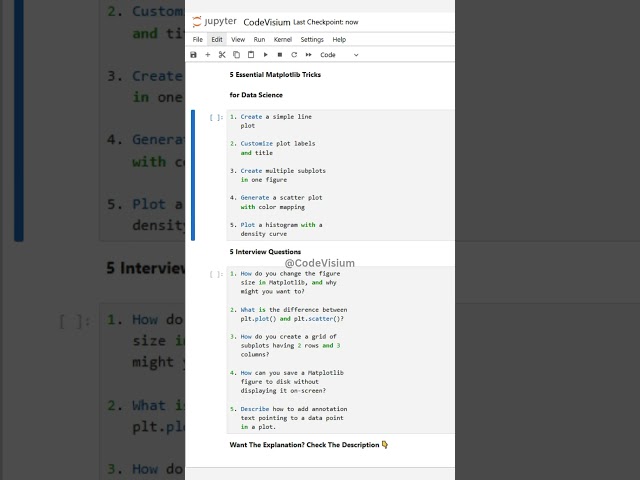
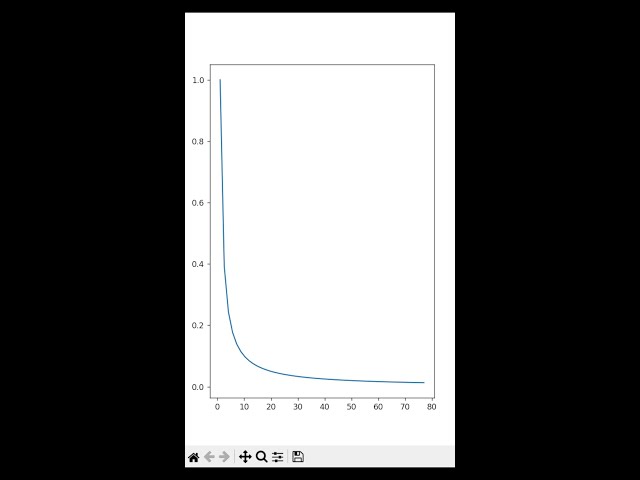
1. Create a simple line plot Drawing a line plot is the foundation for visualizing trends over a continuous variable. In Matplotlib, you ...
626 views
8 months ago
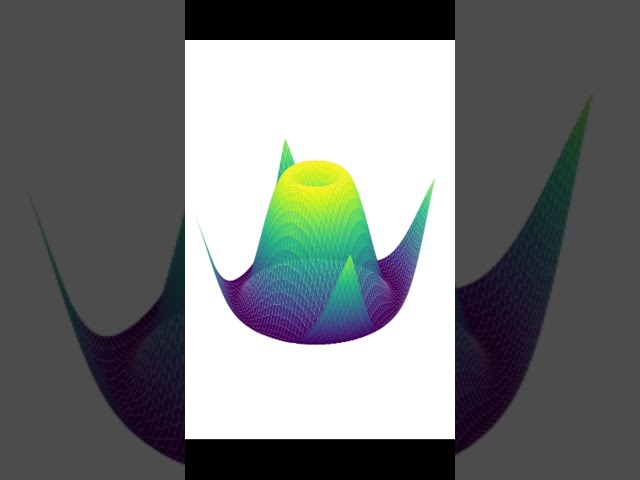
Code: https://github.com/aviwcodes/youtube-shorts/blob/master/plot_shorts/05%20Triangular%203D%20surfaces.py.
4,779 views
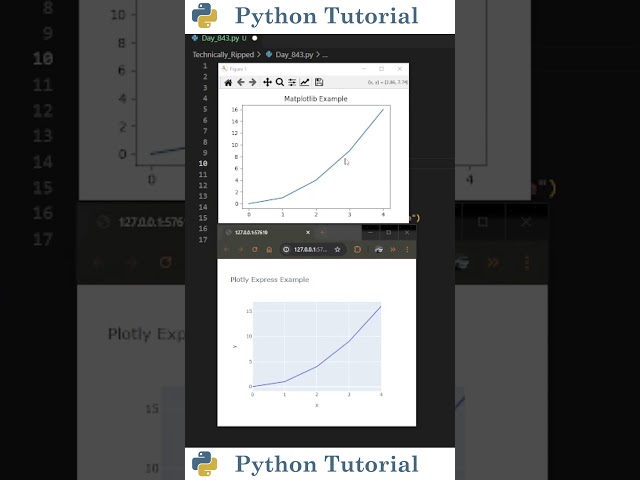
Watch as I compare plotting the same line chart in Matplotlib and Plotly. One gives you a clean, static image while the other offers ...
1,892 views
5 months ago
Tags : #oualicode #python#shorts #oualicode #coding #3d python turtle graphics tutorial python turtle tutorial python turtle ...
21,203 views
13,189 views
Getting started with matplotlib. Introduction to matplotlib. How to create a plot using matplotlib? #coding #learnpython ...
1,028 views
The Matplotlib figure canvas renderer can be confusing to wrestle with if you don't know how it actually works. By the end of this ...
8,703 views
Code: https://github.com/aviwcodes/youtube-shorts/blob/master/plot_shorts/08%203D%20wireframe%20plot.py.
521 views
355 views
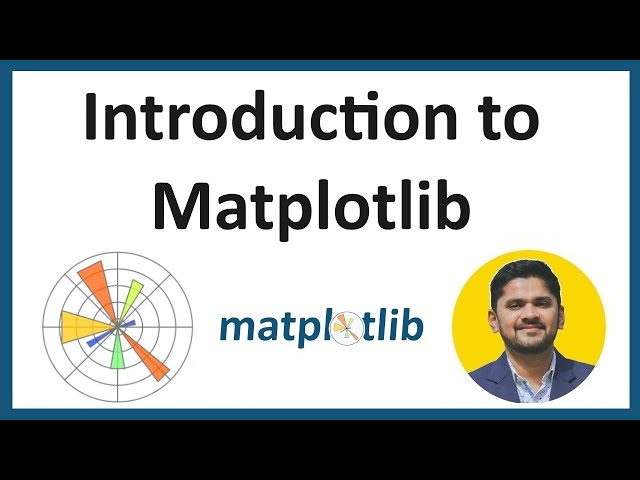
In this video, I am trying to explain about What is Matplotlib? Introduction to Matplotlib Library - Getting Started in Matplotlib?
3,216 views
4 years ago