ViewTube

ViewTube
Sign inSign upSubscriptions
Filters

Upload date

Type

Duration

Sort by

Features

Reset

706,806 results

David Fortin
How to Create Dashboards with Copilot in Excel

How to build insightful Dashboards in Excel with the help of Microsoft Copilot, a powerful AI tool. Copilot Essentials in 15 minutes ...

0:27
How to Create Dashboards with Copilot in Excel

595,271 views

1 year ago

Levelupwithexcel
Use AI in Excel for Data Analysis | No Plugin required

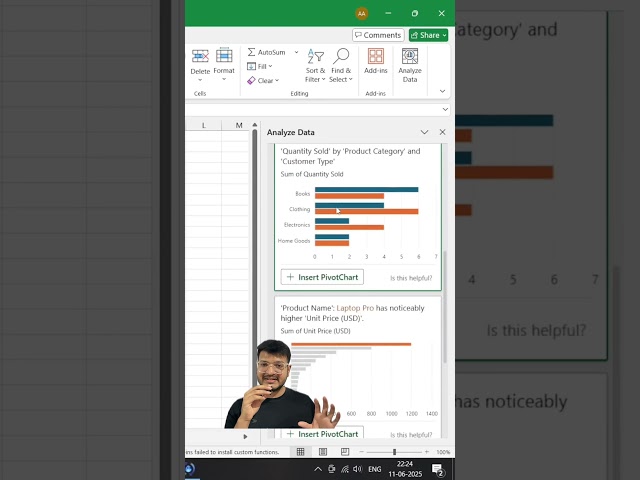
Did you know now you can use AI in Excel to analyze this data just convert it into a table using CtrlT head over to analyze data in ...

0:20
Use AI in Excel for Data Analysis | No Plugin required

252,479 views

7 months ago

Luke Barousse
How I use Excel as a Data Analyst 📊🤓

Follow me on LinkedIn https://www.linkedin.com/in/luke-b/ OR on X/Twitter https://twitter.com/LukeBarousse Subscribe to ...

0:38
How I use Excel as a Data Analyst 📊🤓

253,482 views

3 years ago

Bright Minds Hub
Master Data Visualization & Filtering in Excel Like a Pro! 📊

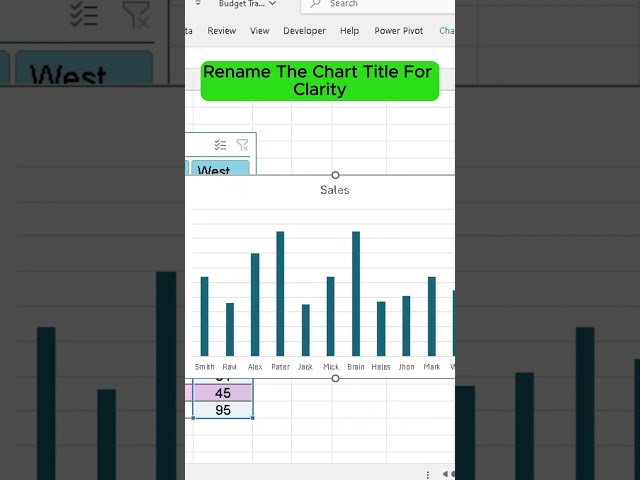
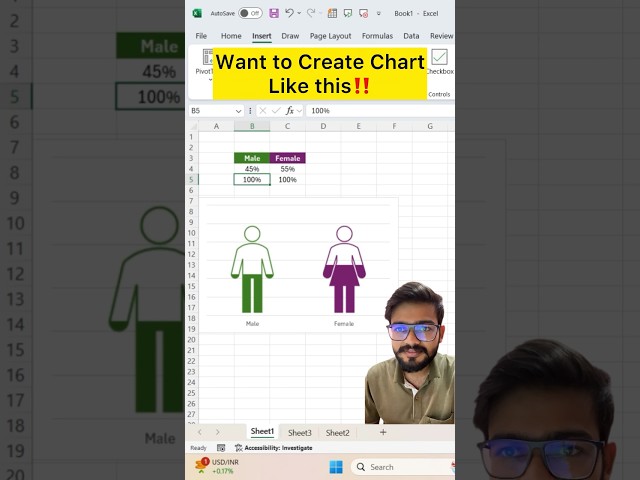
Want to visualize and filter data in Excel like a pro? In this tutorial, I'll show you how to easily create a table, insert a column chart, ...

1:37
Master Data Visualization & Filtering in Excel Like a Pro! 📊

3,251 views

1 year ago

Excel Visual
Excel Dashboard Examples for Data Visualization

Explore stunning Excel dashboard examples designed for clear and effective data visualization. See how charts, graphs, and ...

0:32
Excel Dashboard Examples for Data Visualization

1,121 views

11 months ago

Avery Smith | Data Analyst
What should you learn after Data Analysis for Excel? Data Visualization in Tableau!

What should you learn after Data Analysis for Excel? Data Visualization in Tableau! #Data #Career #DataAnalyst #Analytics.

0:16
What should you learn after Data Analysis for Excel? Data Visualization in Tableau!

525 views

2 years ago

CheatSheets
Python in Excel‼️ #excel #python

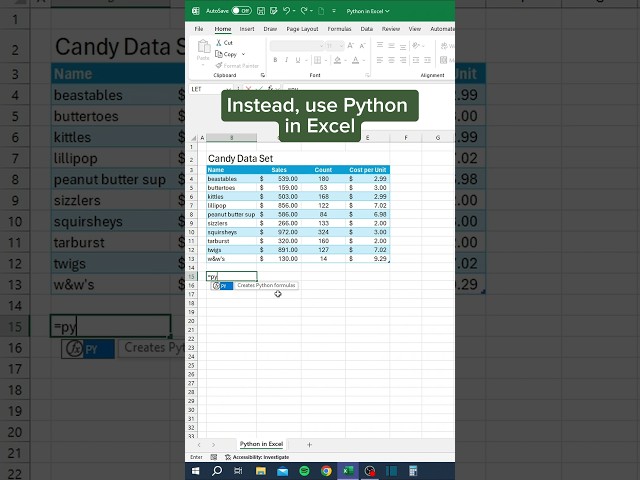
In this video we show a basic function of Python in Excel. ‍ Don't forget to register for a FREE Excel Class at the link below!

0:29
Python in Excel‼️ #excel #python

621,069 views

2 years ago

Excel_Tutorials
A Simple Data Visualization method 😍|  #excel #data #dataanalysis #datavisualization
0:30
A Simple Data Visualization method 😍| #excel #data #dataanalysis #datavisualization

769 views

1 year ago

IICA Computer Education
3 Excel Tips for Stunning Data Visualization | Make Charts & Graphs Like a Pro

3 Excel Tips for Stunning Data Visualization | Make Charts & Graphs Like a Pro Download our app: https://play.google.com ...

1:00
3 Excel Tips for Stunning Data Visualization | Make Charts & Graphs Like a Pro

25,336 views

4 months ago

Excel Dictionary
3 data visualization tricks you need to know. #shorts #excel
0:30
3 data visualization tricks you need to know. #shorts #excel

1,014 views

3 years ago

Short and Clear Excel
Don't Create Boring🥱 Charts‼️Instead Use Amazing Charts #exceltips #excel #shorts #exceltricks

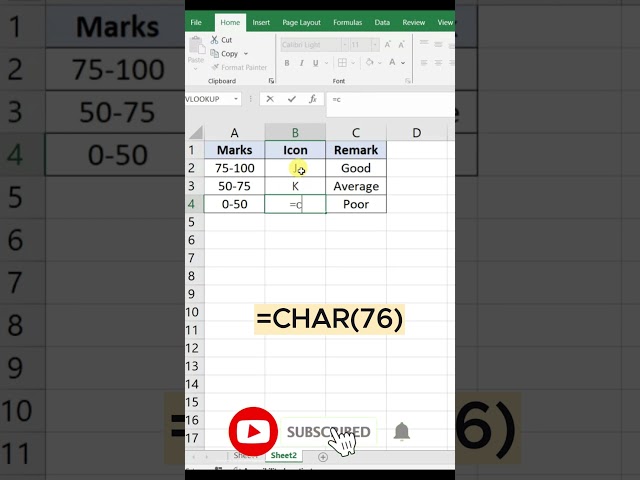
In this video, you will learn how to create Amazing Chart in Excel. Join Telegram Channel to Get Excel Practice Sheets: ...

1:01
Don't Create Boring🥱 Charts‼️Instead Use Amazing Charts #exceltips #excel #shorts #exceltricks

287,166 views

1 year ago

Excel Dictionary
Top 3 Excel data visualization tips you need to know. The last one. 🤯 #excel  #microsoftoffice
0:41
Top 3 Excel data visualization tips you need to know. The last one. 🤯 #excel #microsoftoffice

2,051 views

2 years ago

EliteBps
🌍 Create a Powerful Sales Excel Dashboard

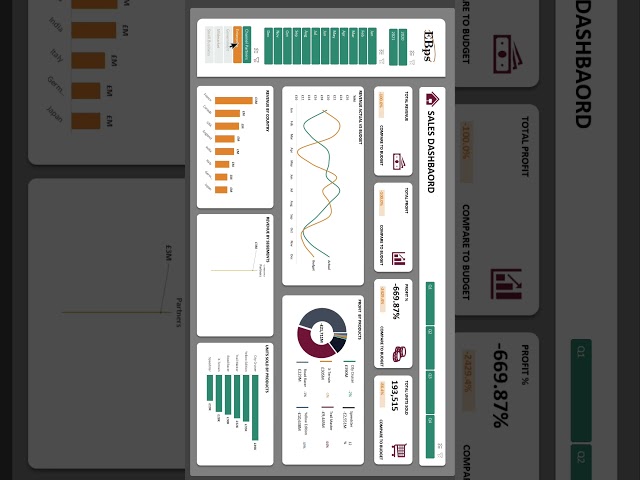
Take your sales reporting to the next level with this comprehensive guide on building a dynamic Sales Excel Dashboard tailored ...

0:18
🌍 Create a Powerful Sales Excel Dashboard

273,916 views

1 year ago

David Fortin
How to Use Copilot in Excel for Data Analysis

How to do Data analysis in Excel with the help of Microsoft Copilot, a powerful AI tool. Download The Copilot Jumpstart Toolkit for ...

0:36
How to Use Copilot in Excel for Data Analysis

784,197 views

1 year ago

Excel Maven
Microsoft Excel - Data Visualization with Excel Charts & Graphs

For more tips like this plus MUCH more, get unlimited access to the full course below: ...

1:47
Microsoft Excel - Data Visualization with Excel Charts & Graphs

31,084 views

8 years ago

Tech Table Tutor
Quick Analysis Tool in Excel: Analyze Data in a Flash!⚡Excel Shortcut #excel #excelshorts

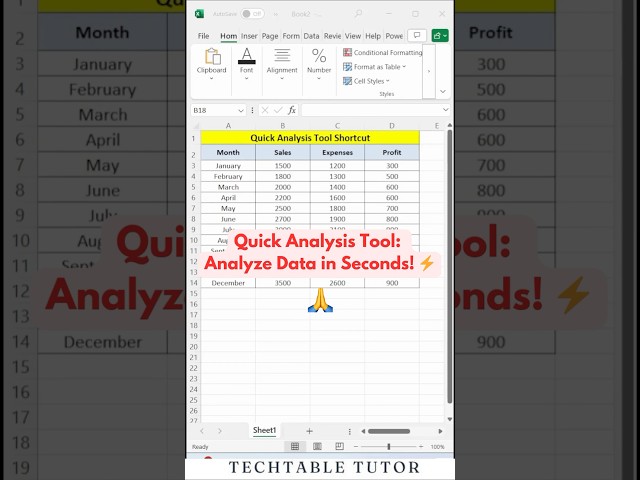
Quick Analysis Tool in Excel: Analyze Data in a Flash! ⚡ In this video, we'll dive into the powerful Quick Analysis Tool in Excel!

0:18
Quick Analysis Tool in Excel: Analyze Data in a Flash!⚡Excel Shortcut #excel #excelshorts

312,853 views

1 year ago

Bright Minds Hub
How to Use Sparklines in Excel for AMAZING Data Visualization!

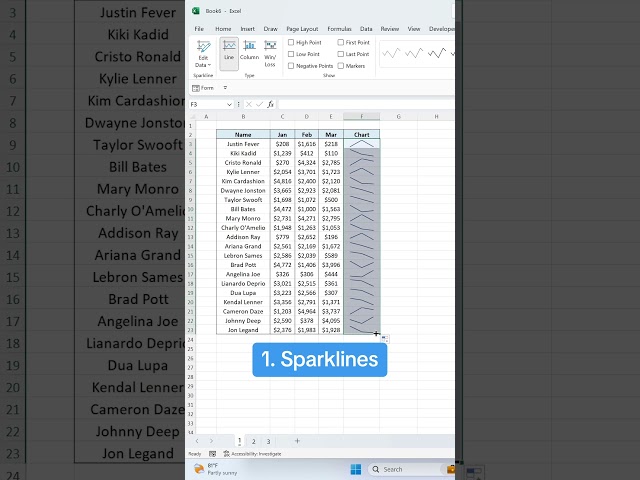
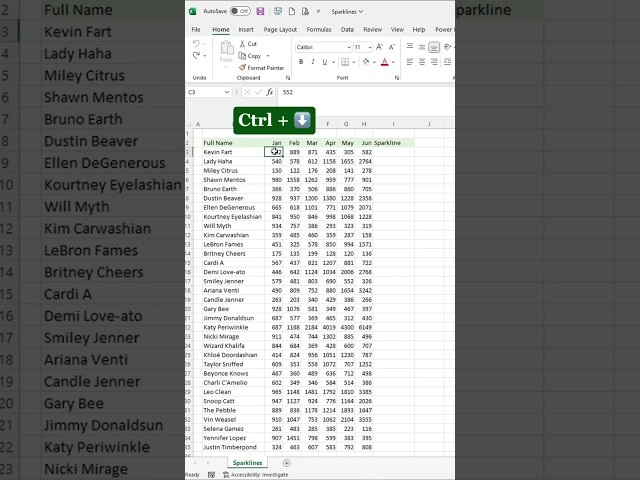
Discover the power of Sparklines in Excel and elevate your data visualization skills to the next level! In this video, we'll walk you ...

0:23
How to Use Sparklines in Excel for AMAZING Data Visualization!

9,949 views

1 year ago

Bright Minds Hub
Auto Highlight Row in Excel 🌟 EASY Tutorial 🔥 || Excel Tips

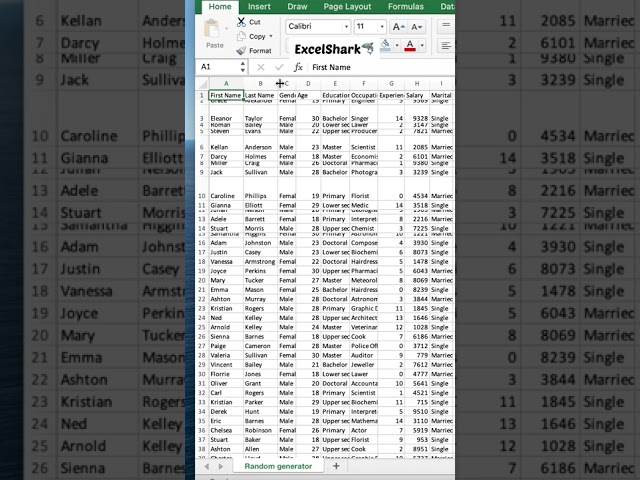
Unlock the power of Excel with our easy tutorial on how to auto-highlight rows! In this step-by-step guide, we'll show you simple ...

0:56
Auto Highlight Row in Excel 🌟 EASY Tutorial 🔥 || Excel Tips

771,146 views

1 year ago

ExcelShark
Quick clean messy data. #excel #exceltips #microsoftexcel #microsoft #exceltutorial
0:18
Quick clean messy data. #excel #exceltips #microsoftexcel #microsoft #exceltutorial

237,390 views

3 years ago