Upload date
All time
Last hour
Today
This week
This month
This year
Type
All
Video
Channel
Playlist
Movie
Duration
Short (< 4 minutes)
Medium (4-20 minutes)
Long (> 20 minutes)
Sort by
Relevance
Rating
View count
Features
HD
Subtitles/CC
Creative Commons
3D
Live
4K
360°
VR180
HDR
98,400 results
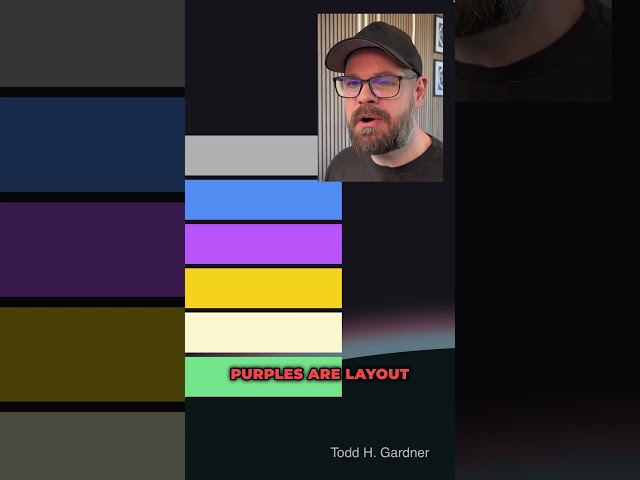
Learn how to decode flame charts in this essential Concepts of Web Performance tutorial with Todd Gardner from Request Metrics ...
226 views
10 months ago
Google Chrome DevTools Emulate a Focused Page Download my FREE "Google Search Secrets for Developers" Cheat Sheet: ...
4,855 views
4 years ago
Debug CLS with Performance Insights in the updated Chrome DevTools Performance panel and make your website faster - and if ...
37,583,895 views
4 months ago
In this lesson, we take a look at the built-in Test Recorder hidden away in the chrome developer tools. This can be a great help ...
12,852 views
3 years ago
Jecelyn walks you through the basics of getting started and tips for Chrome DevTools. Watch more DevTools Tips ...
22,285 views
1 year ago
Chrome Remote Debugging is the way to use DevTools for websites running on an Android device. Most people use USB cable ...
67,024 views
Unlock the hidden potential of Chrome DevTools and capture stunning website screenshots like a pro! This video dives into how ...
8,342 views
Debug LCP with Performance Insights in the updated Chrome DevTools Performance panel and make your website faster - and if ...
36,385,294 views
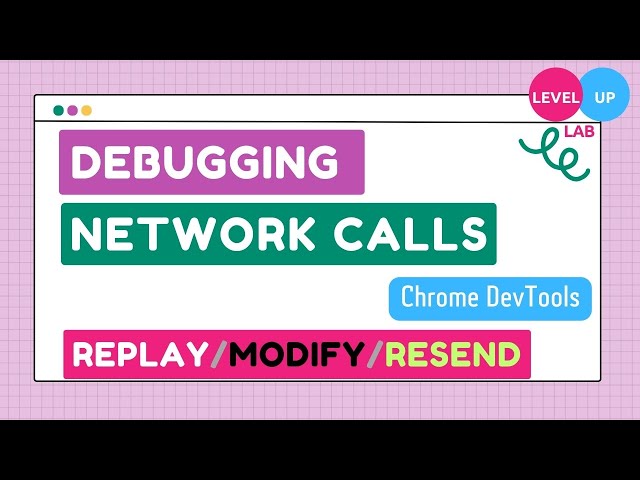
This video is about debugging network requests of any web application in Chrome dev tools. Here you can watch steps to replay ...
8,083 views
2 years ago
Using the built-in JS debugger in Chrome to debug and inspect server-side NodeJS code. ▻ Other places on the internet ...
1,770 views
5 years ago
A quick tip outlining how to enable Font Editor in Chrome DevTools, which enables you to tweak typography dynamically. Support ...
2,867 views
Never lose your place in the Performance panel timeline again. Zoom in and set a breadcrumb to clamp the boundaries of the ...
7,783 views
Tweet to us: Jecelyn Yeen → https://twitter.com/jecfish Chrome DevTools → https://twitter.com/chromedevtools Catch more ...
152,629 views
When your teammate's asleep but the code's gotta be fixed! Check out how AI Assistance can help you debug CSS and style ...
9,980,579 views
Get ready to unlock the hidden potential of Chrome DevTools and capture stunning website screenshots like a pro! This video ...
23,728 views
In this video we will learn that How do I open Developer Tools in Chrome with keyboard? Subscribe my channel ...
124,993 views
Inspect Element is a powerful tool for web developers to analyze, debug and modify web pages. Learn tips and tricks to unlock its ...
723,480 views
Test UI changes and production fixes with the powerful network response overrides in Chrome DevTools. Learn to override and ...
14,059 views
Learn how to capture the full network activity of pop-up windows in Chrome DevTools. Watch more DevTools Tips ...
4,091 views
11 months ago
Learn about the AI assistance panel in DevTools, designed to help with CSS styling and more. Learn more at ...
1,660 views


![Debugging Nodejs using Chrome Dev Tools [Two Minute Tuesday]](/api/proxy/image?url=https%3A%2F%2Fi.ytimg.com%2Fvi%2FP9u4RTmso_g%2Fsddefault.jpg)