Upload date
All time
Last hour
Today
This week
This month
This year
Type
All
Video
Channel
Playlist
Movie
Duration
Short (< 4 minutes)
Medium (4-20 minutes)
Long (> 20 minutes)
Sort by
Relevance
Rating
View count
Features
HD
Subtitles/CC
Creative Commons
3D
Live
4K
360°
VR180
HDR
3,905 results
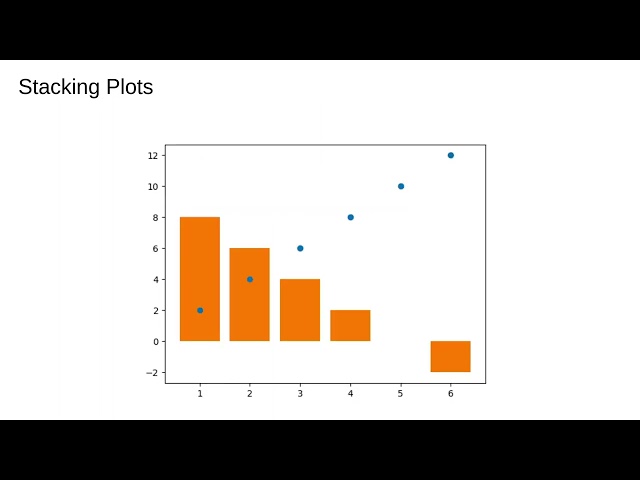
Showing some of the basic customization options for the most common pyplot functions like plot, scatter and bar.
426 views
3 years ago
Example of an animation with various subplots and axes using Python and Matplotlib.
21,472 views
13 years ago
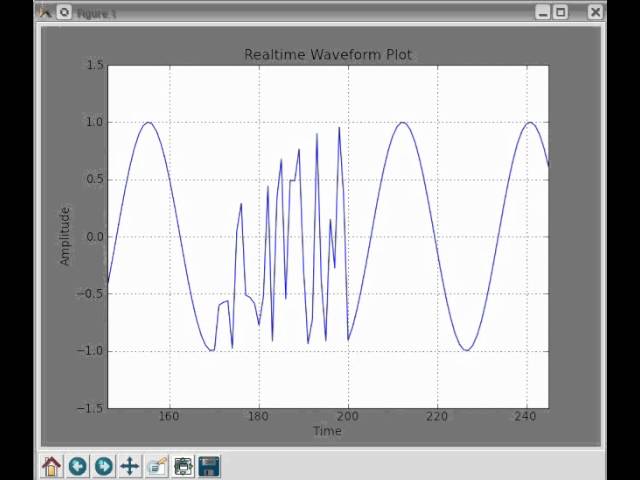
Realtime Plotting with Python and pylab/matplotlib More info and source code at: ...
30,455 views
14 years ago
In this video we show how to make some simple animations, including a rotating 3d plot.
616 views
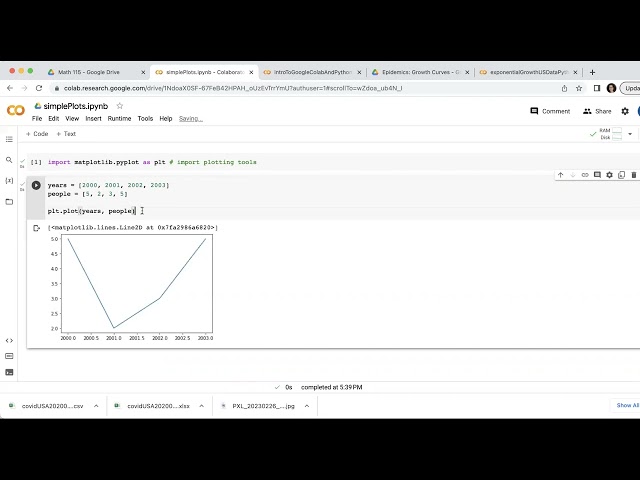
How to make a simple line plot and scatterplot using Python's matplotlib in Google Colab.
529 views
2 years ago
Dive into the world of data visualization with this comprehensive guide to mastering Matplotlib in Python! In this tutorial, we'll ...
56 views
Simple demo of an interactive 3D Matplotlib.
451 views
11 years ago
In this video, we delve into a common challenge faced by Python users when working with Matplotlib: keeping the plot window in ...
3 views
1 year ago
I received some requests in response to how some of the code works in our data presentations over the weekend. Although not ...
747 views
5 years ago
In this video, we'll dive into the world of data visualization using Matplotlib, one of the most popular libraries in Python. Specifically ...
2 views
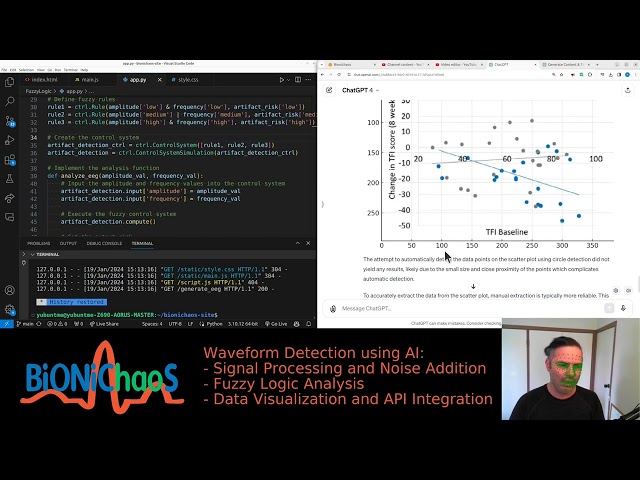
In this video, I share my experience with GPT-4 extracting data from a challenging paper. I attempted to use Matplotlib and Numpy ...
96 views
In this video, we'll explore the essential techniques for sorting the X-axis in Matplotlib, a powerful plotting library in Python.
41 views
In this video, we will explore the fascinating world of k-Nearest Neighbors (k-NN) and how to visualize its decision boundaries ...
4 views
5 months ago
In this video, we dive into the exciting world of dynamic plotting using Matplotlib's animation capabilities. Whether you're a data ...
6 months ago
In this video, we dive into the essential techniques for managing memory when using Matplotlib in Python. As data visualization ...
5 views
7 months ago
In this video, we'll explore how to use the `imshow` function in Python's Matplotlib library to display a single color image. Whether ...
10 months ago
In this video, we'll explore the powerful capabilities of Matplotlib for creating subplots with dual Y axes. Whether you're visualizing ...
In this video, we'll explore how to customize the position of legends in Matplotlib by using graph coordinates. Understanding how ...
1 view
u_t - u_xx with triangular initial condition u(x,t) = infinite series from n=1: 4/(n*pi)^2 sin(n*pi/2) sin(n*pi*x) exp(-(n*pi)^2*t) ...
473 views
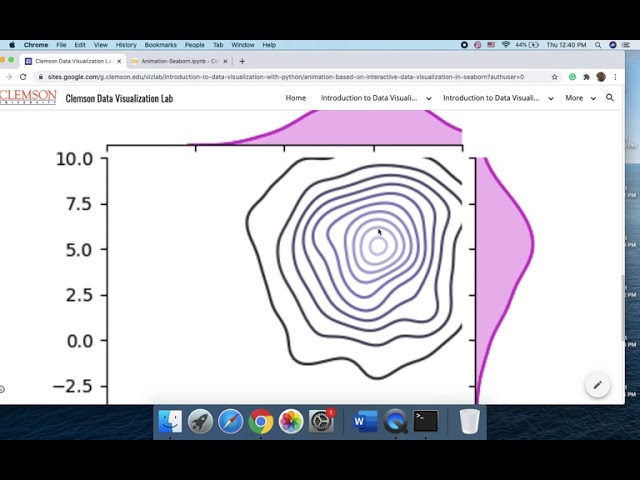
Developing animation based on transient data and using built-in functionalities of matplotlib and seaborn.
580 views