Upload date
All time
Last hour
Today
This week
This month
This year
Type
All
Video
Channel
Playlist
Movie
Duration
Short (< 4 minutes)
Medium (4-20 minutes)
Long (> 20 minutes)
Sort by
Relevance
Rating
View count
Features
HD
Subtitles/CC
Creative Commons
3D
Live
4K
360°
VR180
HDR
71,671 results
Sumantro Mukherjee from Red Hat shows how Toolbx helps you debug your project, test different use cases and keep your base ...
190 views
2 years ago
Perhaps use this approach to better understand what your Go based command line interface (CLI) apps are doing. 00:00 Setup ...
2,277 views
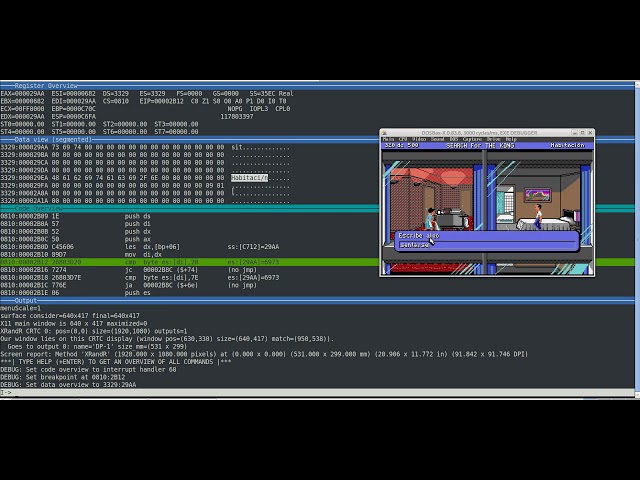
De dinamitas, mechas y artificieros. Mas info: DOS cracking: Programando un TSR para interceptar, en una aventura ...
1,200 views
5 years ago
Announcing ChromeDevTools MCP! Connect your AI coding agent to Chrome's powerful automation & debugging capabilities ...
14,907 views
6 months ago
Discover 5 different ways to debug your code beyond console.log - Discover the breakpoints, debugger statements, logpoints, ...
45,944 views
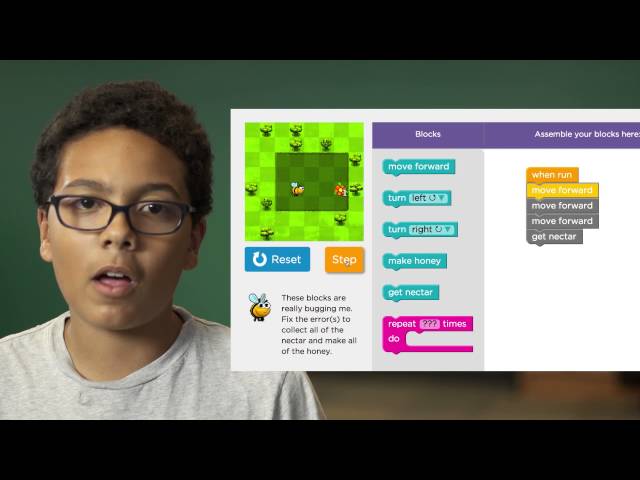
This is part of Code Studio. Check it out at http://studio.code.org Help us caption & translate this video! http://amara.org/v/61SA/
1,202 views
10 years ago
In this video we will introduce you to our series of videos where you will learn how to run a bare metal application in debug mode ...
1,099 views
4 years ago
shorts Check out the channel to learn how to do this yourself!
3,823 views
Boost your development workflow with Gemini integrated directly into Chrome DevTools. With AI assistance, you can now get ...
21,261,714 views
10 months ago
It's not often... but every few months, one of our sensor drivers stops working due to hardware changes. It happened this week with ...
4,740 views
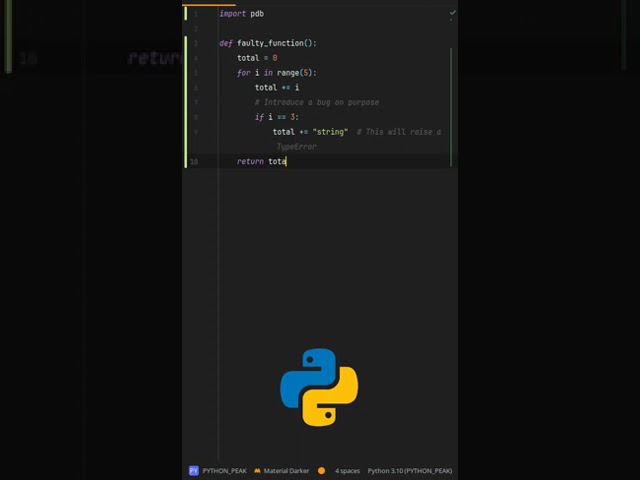
What's the best way to debug Python code with pdb? 🎟️ Using pdb makes finding bugs easier and faster. 🎟️ You can pause ...
7,159 views
1 year ago
While WordPress's built-in debugging options should cover most of your needs, there are a number of plugins that can help you ...
1,853 views
We shipped 5 AI features in Chrome DevTools to simplify debugging! I'm excited to share that over in Chrome DevTools we've ...
1,527 views
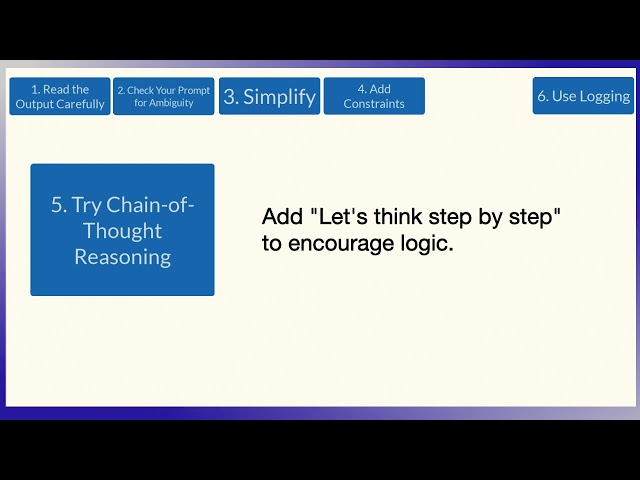
In this video, we'll walk through a practical debugging workflow. Debugging prompts is like debugging code. Here's a step-by-step ...
85 views
8 months ago
LCP is short for Largest Contentful Paint. Debug LCP with Performance Insights in the updated Chrome DevTools Performance ...
36,385,486 views
You can watch this class without ads and with quizzes and lab setup instructions by going to https://ost2.fyi/Arch2001.
846 views
3 years ago
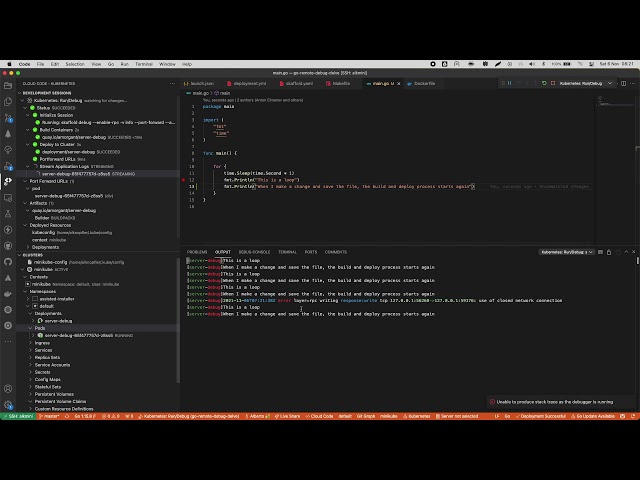
Use VS Code's Cloud Code extension with Delve and Skaffold to remotely debug a Go-based application deployed on ...
6,626 views
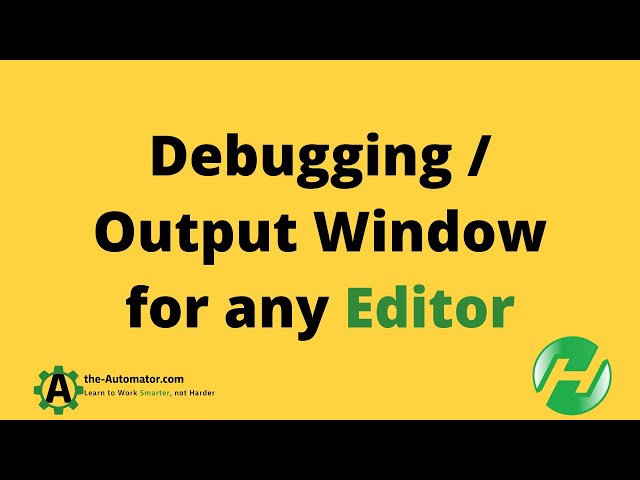
If you work with multiple editors, or collaborate with people that use different ones, it can be a pain to change how the debugging ...
528 views
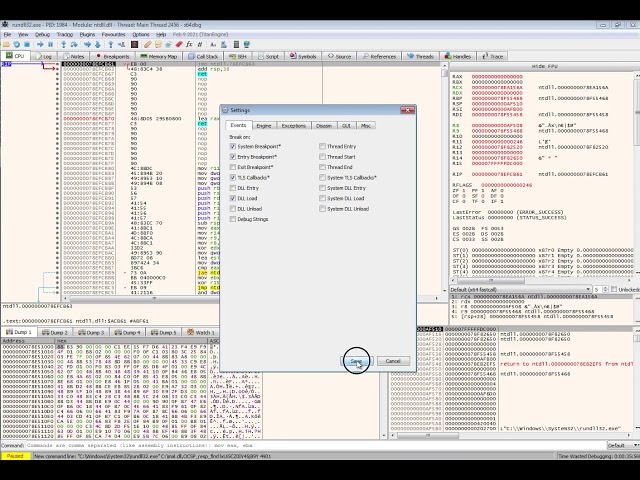
You want to debug a malware that arrives as a DLL file and has an exported function called with command line arguments?
9,793 views
What's the quickest way to debug PHP code? Using error_reporting can show all errors quickly. Combine it with ...
1,470 views