Upload date
All time
Last hour
Today
This week
This month
This year
Type
All
Video
Channel
Playlist
Movie
Duration
Short (< 4 minutes)
Medium (4-20 minutes)
Long (> 20 minutes)
Sort by
Relevance
Rating
View count
Features
HD
Subtitles/CC
Creative Commons
3D
Live
4K
360°
VR180
HDR
1,787 results
Tweet to us: Jecelyn Yeen → https://twitter.com/jecfish Chrome DevTools → https://twitter.com/chromedevtools Catch more ...
152,241 views
4 years ago
Announcing ChromeDevTools MCP! Connect your AI coding agent to Chrome's powerful automation & debugging capabilities ...
13,938 views
4 months ago
Tips on debugging CSS Flexbox with Chrome DevTools. Chapters: 0:00 - Intro 0:08 - Flexbox editor 0:49 - Flex badge and overlay ...
25,547 views
3 years ago
Tweet to us: Jecelyn Yeen → https://goo.gle/jecfish Chrome DevTools → https://goo.gle/chromedevtools Catch more DevTools ...
43,705 views
2 years ago
Get ready to unlock the hidden potential of Chrome DevTools and capture stunning website screenshots like a pro! This video ...
23,201 views
1 year ago
45,408 views
Chrome & Chromium DevTools can now debug CSS Grids, helping you discover CSS grids on a page, examine them and debug ...
2,058 views
5 years ago
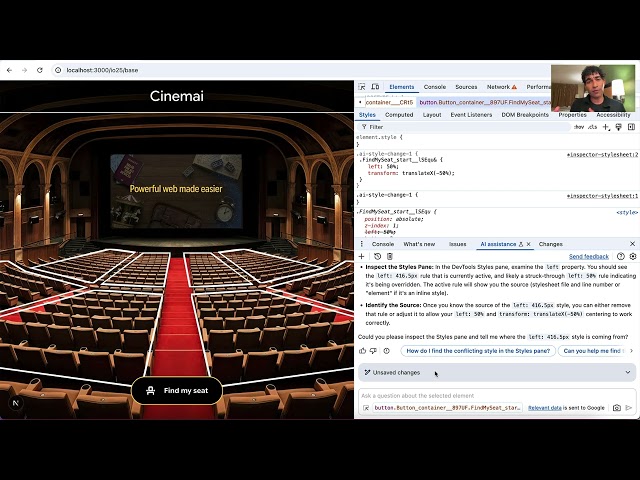
At #googleio, we announced AI assistance _across_ DevTools, enabling you to chat with Gemini to debug smarter. You can now ...
1,215 views
8 months ago
Sharing some useful shortcuts and settings for quicker DevTools navigation. Chapters: 0:00 - Intro 0:08 - Shortcut to open the ...
80,653 views
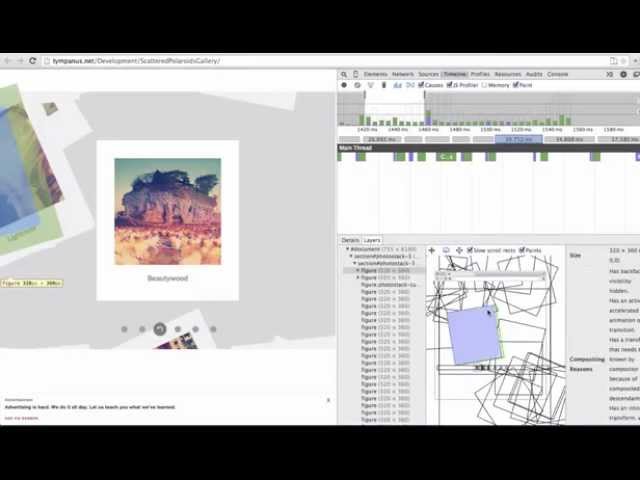
Turn on the Paint checkbox and see what happened inside each frame, looking at the layer tree as it changes. Keep paint ...
12,700 views
10 years ago
Short video on accessing the Coverage tool in Chrome Dev Tools.
247 views
6 years ago
"/.well-known/appspecific/com.chrome.devtools.json"' request I hope you found a solution that worked for you :) The Content is ...
104 views
This video helps you to quickly spot the Largest Content Paint node with DevTools of Chome.
1,187 views
See the details within each paint operation, a histogram of all the draw calls and then jump to associated element. Keep paint ...
6,670 views
Learn what Angular DevTools is and how to use it to preview your application and profile its performance. Resources: Angular ...
14,421 views
We shipped 5 AI features in Chrome DevTools to simplify debugging! I'm excited to share that over in Chrome DevTools we've ...
1,494 views
In this video Surma introduces a lesser-known DevTools feature that helps analyzing layers and animations. If you have questions ...
24,054 views
8 years ago
My debugger is stuck in react-dom.js, again Devtools allows you to ignore all framework related code while stepping through ...
491 views
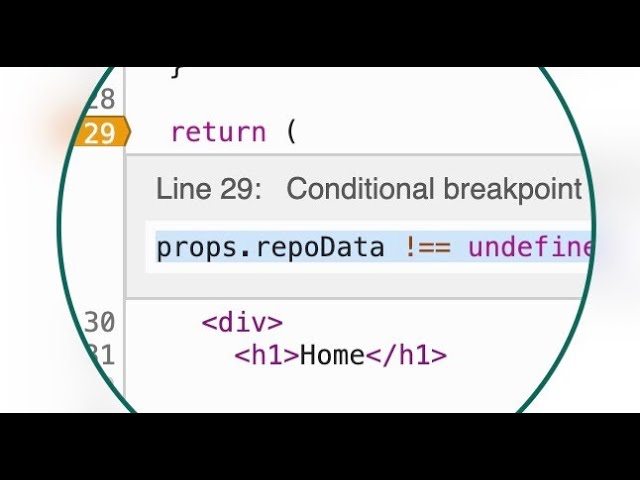
Those breakpoints keep hitting too often If you have to resume a breakpoint 4-5 times before you find the intended scenario, ...
1,271 views
Answer to http://stackoverflow.com/q/10318197/89484 One cool feature I didn't show: If you like your new adjustments to the script ...
22,391 views
13 years ago